

Table of contents
- The Setup: from large services to FaaS-like pods
- Problem 1: Startup times matter now
- Drilling in: finding the exact source of CPU time
- The ‘one weird trick’ with require to optimize your pod startups
- 300 milliseconds == a whole lot of cost savings
- Coming in Part 2: anti-patterns and the exception that proves the rule
I want to tell the story of how we saved 300ms from every pod start up on Checkly, and made every check run more efficient. If you don’t know, Checkly is a synthetic monitoring tool that lets teams monitor their API’s and sites continually, and find problems faster. With some users sending millions of request a day, that 300ms added up to massive overall compute savings. The story of how we saved that time takes us through Application Performance Monitoring, to low-level instrumentation, to ‘one weird trick’ that saves tons of startup time, all the way to a coding practice that most would call an anti-pattern, but nonetheless improved performance significantly.
In 2024 our platform team had FinOps as a goal: trying to find savings in our cost per user. We pursued the total compute time as one of the ways we could save time and money. The journey begins on AWS ECS.
The Setup: from large services to FaaS-like pods
When I started this optimization journey last year, check runs were run from a service in an Amazon ECS Container. This large service received checks from an SQS queue, and continuously ran new check runs as needed. This approach had its advantages, among them that startup time wasn’t a concern, since startups of these containers were rare.
There were two significant downsides to our ECS architecture:
- With large containers running many checks, autoscaling wasn’t very flexible.
- The fact that one container was handling requests from many clients meant we had to work hard to clean up all data between runs. This added a lot of complexity to the codebase.
We're now running our checks on ephemeral pods in a Kubernetes cluster. Containers being spun down after the check run meant we didn’t have any extra work to clean up user data between runs. Similar to a FaaS setup, our compute was only in use as the check was running. This meant our autoscaling was now extremely fine-grained.
Problem 1: Startup times matter now
With this new arrangement, pod startup times really matter. With ephemeral pods starting up for each check run, startup times represent compute time and platform cost. Since we’ll scale up directly with business growth, we had to get in control of startup times to grow efficiently.
The first fix: the chunky AWS SDK
When we started optimizing container startup times, we knew the standard advice: the smaller the container image, the faster your container will start. An early optimization we identified was the of the AWS SDK. Adding about 70 megabytes to the package size, the AWS SDK for Javascript includes clients for every AWS service under the sun. The bigger the container images we ship the slower they are to download and start in a pod. On top of the container size issue, remember that Javascript is interpreted: parsing all of this code is also expensive and takes longer. But enter the AWS SDK version 3! This new SDK was modular, allowing you to import only the chunks you need. This was the first lesson of our optimization journey:
💡 The first lesson: Do not require things you don’t need.
With the V3 AWS SDK, you don’t have to bring in the whole SDK, and there’s a nice clear readable format for bringing in a submodule
const S3 = require("aws-sdk/clients/S3");
const s3Client = new S3({});
await s3Client.createBucket(params);
Some code rewrite was required for this step, but not much! It was mainly a 1-for-1 replacement to bring in the 5 AWS submodules that we actually use rather than the whole SDK.
However, switching to this more optimized require process didn’t improve start times as much as we’d hoped, and CPU times were still higher than expected. It was time to go deeper.
Drilling in: finding the exact source of CPU time
To try to find the source of our increased CPU time, we went with the simplest observability technique: log lines. When our ephemeral pods start up, there’s a specific moment when they report themselves as ready to receive a task from Amazon SQS. By adding a single log line , we could see the time it took for each pod to be ready.
The time it took for the pod to be ready wasn’t done with some cool Kubernetes call or ECS magic, instead it’s just three lines of application code within our check runner:
    const processStartedAt = Date.now()
    const fondue = require('cheese:hot')
    // more require statements

    const timeUntilMessageMs = Date.now() - processStartedAt
    timeUntilMessageHistogram.observe(timeUntilMessageMs)
    console.log(`msg="Received message" after_ms=${timeUntilMessageMs} ready_to_receive_after_ms=${readyToReceiveMessageAfterMs}`)
This brings us to the second lesson about pursuing slow starts, high CPU, or other low level performance issues:
💡 The second lesson: profilers and APM are cool and all, but sometimes to find a problem you need to get your hands dirty in your application code.
It’s nice to have a shiny tool that lets you analyze code performance without modifying your application code. That’s true when you’re dealing with runaway logging or noisy alerts, or private data being sent to the wrong logging system. But when you need to know why your code is performing poorly, it makes sense to empower developers to just add direct measurement to the application code. There is no harm in using boring/simple methods if the results are right. After all: the fix is going to be in the application code anyway. Also: the good old trial & error method of modifying the code and seeing how the performance changes goes a long way. When all else fails you can always start the application with half the code commented out, then switch the active code, and binary search your way to the problem area 🤣.
In the situation above, adding this log line was a much more accurate and efficient way to find the time to ‘ready’ than trying to filter existing logs to estimate how long pods were taking to start up. It’s great to have cool dashboards and profilers, but when you want a very specific answer, sometimes adding logging is the way to go.
It’s true that you shouldn’t be adding hundreds of log lines for every request handled, so a good rule of thumb is ‘am I logging something I’m likely to care about next month?’ In my case, the startup time of our pods was always something we would care about, so it was an easy ‘yes.’ I added the above logging code and we dove in.
Treating Logs as Metrics with Grafana Loki
Now every production check run was logging its time to receive, but of course a single measurement, or even dozens, wouldn’t give a clear pattern. Despite my simple, unstructured log message I wanted to be able to treat the reported data as a metric. That’s where Grafana Loki came in.
With the Grafana Loki logfmt method, I could use real LogQL expressions (similar to PromQL) to query the unstructured logs and treat is as a metric.
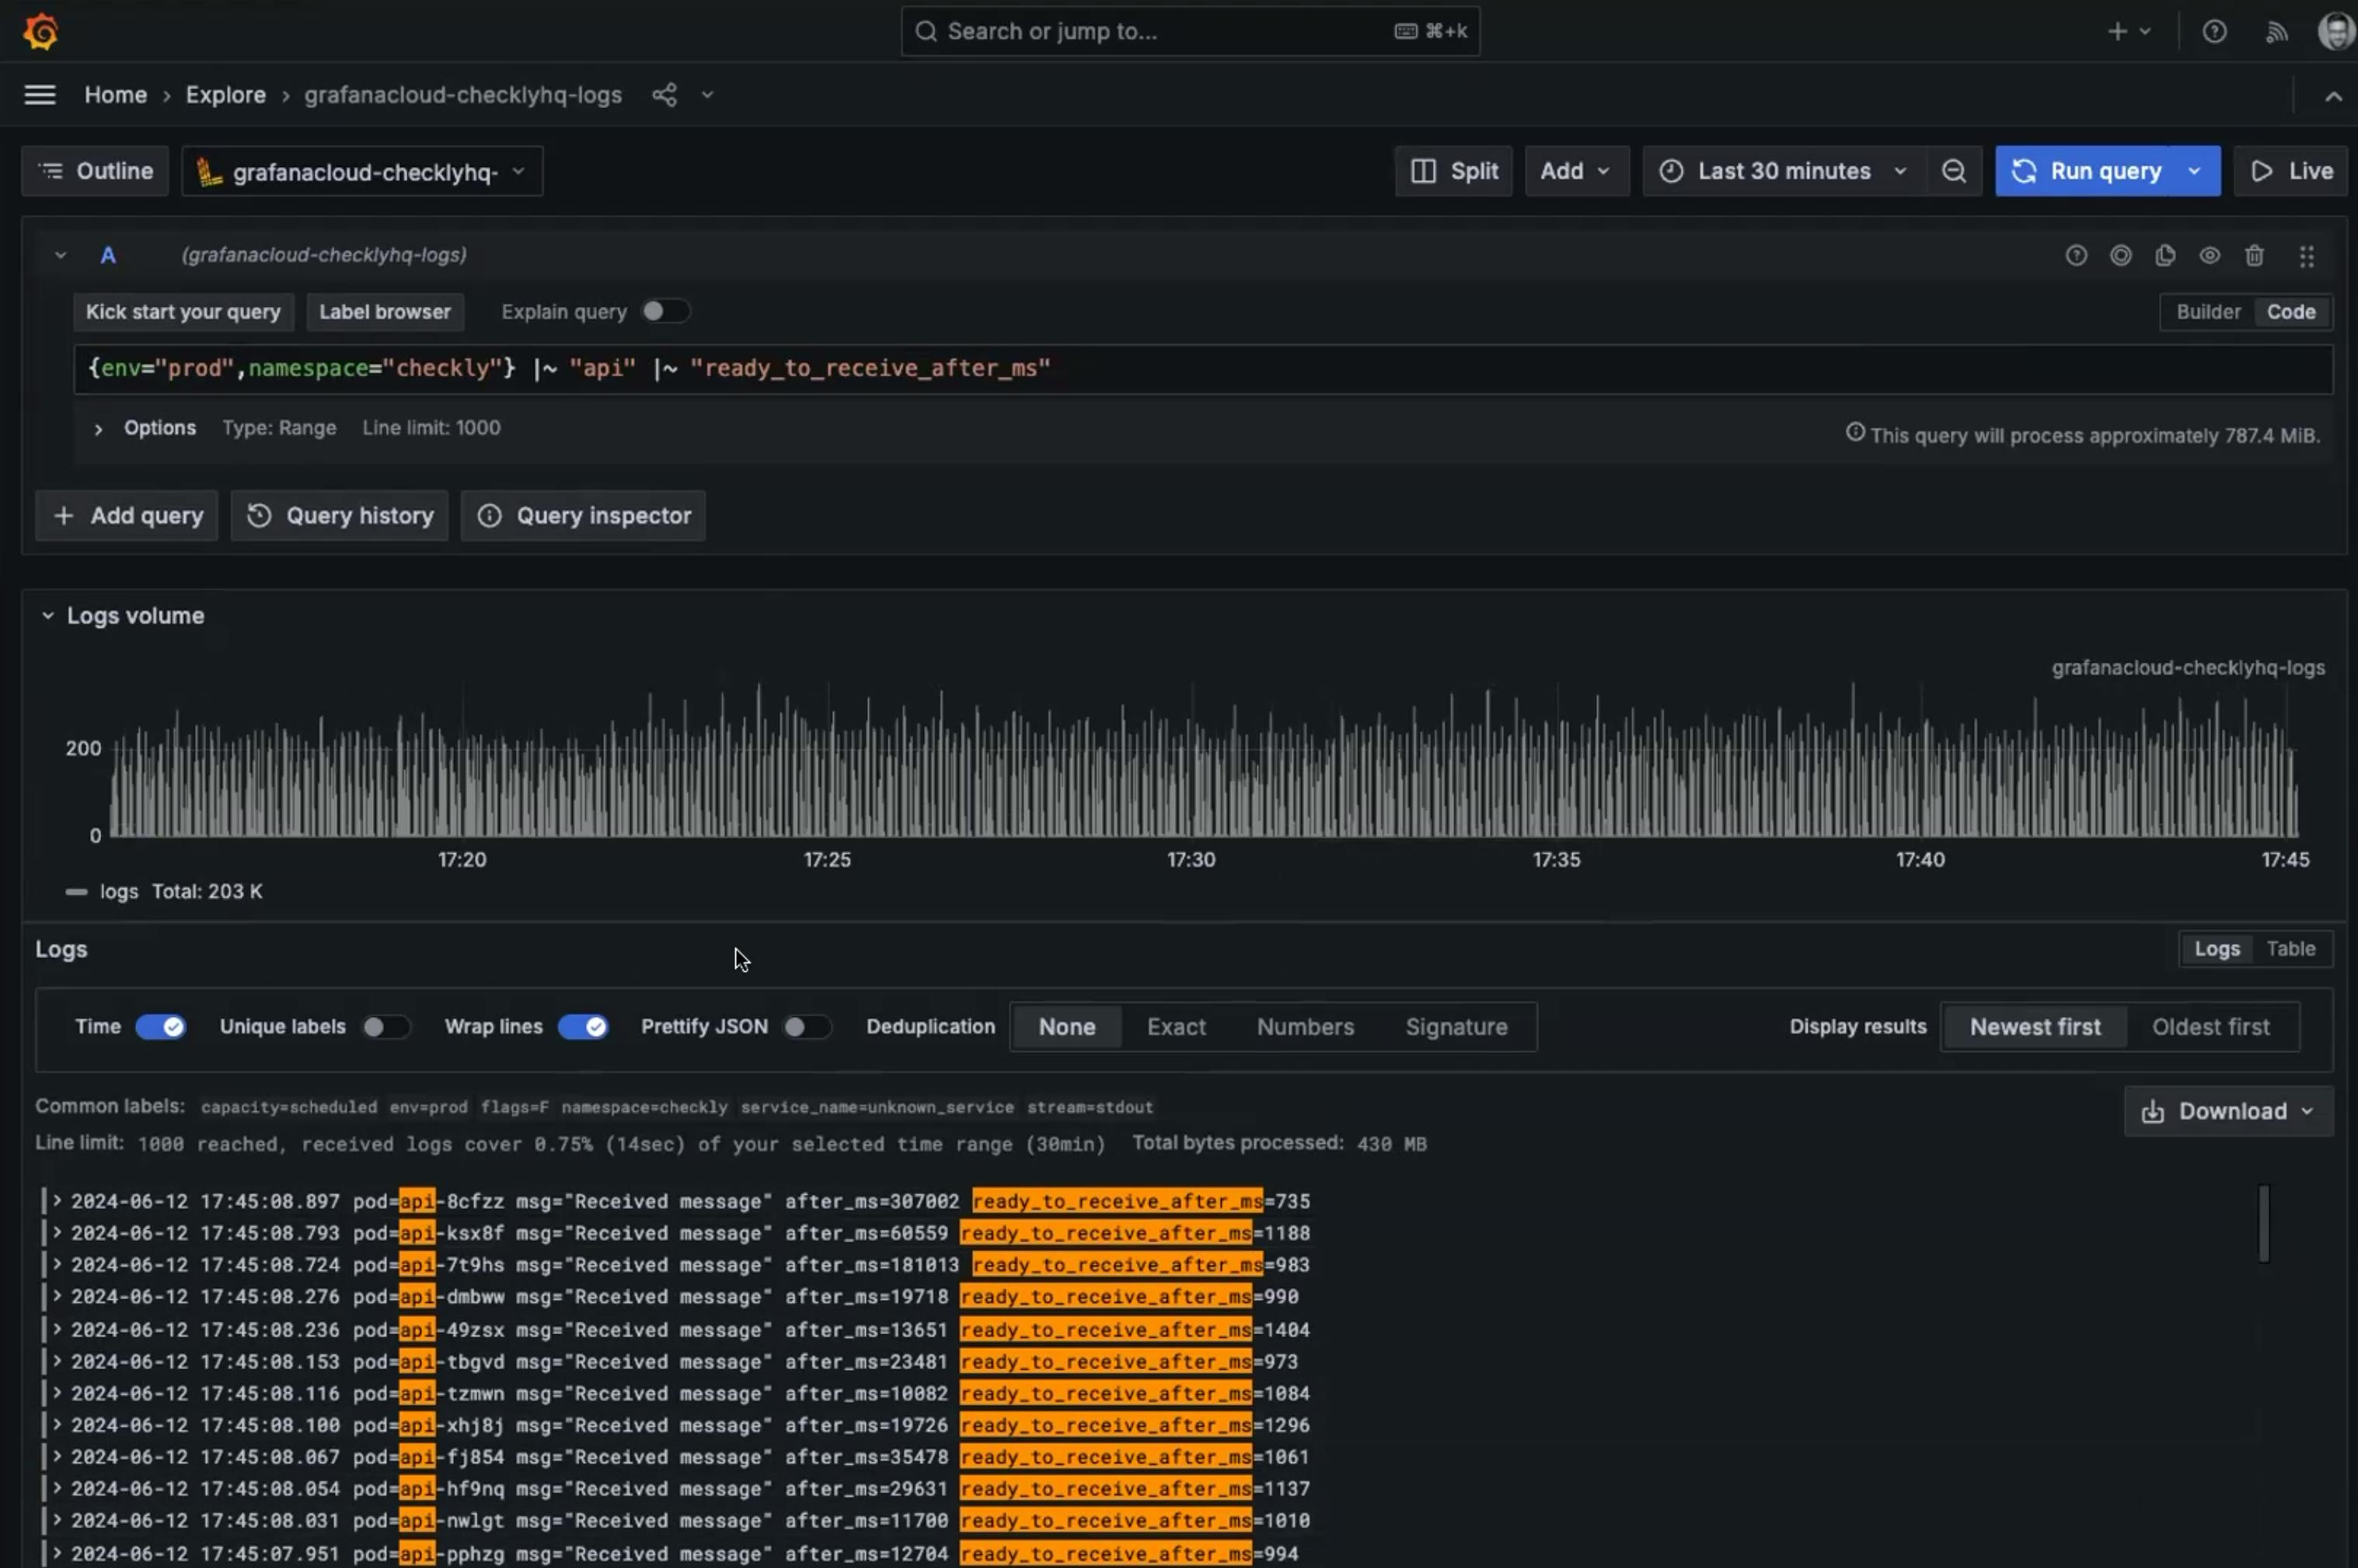
The team absolutely loves this, since it means you don’t have to be a regular expressions genius to query your logs and chart the results. Another hidden bounus of logfmt: you can put many values in a single log line.
The Problem, part 2: over three seconds to prepare
With this new measurement in place, we found startup times of about 3 seconds. This seemed extremely high. I had estimated that Javascript pods would take about 1 second to be ready. At this point I started to get concerned about the experience for new users of Checkly: while the vast majority of Checkly monitoring check runs happen on a schedule, when new users are setting up checks, or developers are experimenting checks, the user is waiting from the moment they schedule a check to the moment they have results. We called this ‘scheduling day’ and it’s critical for our user experience. I didn’t really need motivation to solve this problem, but this was another reason this delay had to be resolved.
Fix 2: Changing the order of operations
We shifted our order of operations to optimize performance. Rather than having a message in queue be the trigger to start a container, instead we had a container start internally, then take a message from the queue. This meant that the overlong startup time no longer affected the user experience directly. However, it didn’t actually solve the suspiciously long startup time. Excess time to prepare the pod was no longer affecting users, but it still affected our AWS bill!
Time to find the cause of slow starts: monkey-patching require
When a pod starts and takes a while to get ready, required packages are usually the culprit. One team-mate suggested using a bundler to remove unnecessary components, but that had its own technical lift.
Without a clear path forward, I tried something straightforward to see what might be causing delays in the startup. The first thing that I suspected was external modules as the culprit, so I added the following snippet with a . prefix filter.
const originalRequire = require
global.require = (pathName) => {
	 const start = Date.now()
	 const result = originalRequire(pathName)
	 if(!pathName.startsWith('.')){
		 console.log(`${pathName} ${Date.now() - start}`)
	 }
	 return result
}
After some trial and error, I found that the source of the longest require times were for the AWS SDK. That’s right, the same SDK that we’d optimized previously. We’d already done our best, what could possibly cause such bloated require times?
The ‘one weird trick’ with require to optimize your pod startups
When you run an npm install command while working with code, npm automatically grabs the current version of the package and adds it to the at modules package.json file. As modules had been added throughout our development process, there were a large variety of AWS SDK versions required in different package.json files. As we’d moved to only requiring submodules, there were a large variety of versions referenced than before. This innocuous code in one of our files:
"@aws-sdk/client-firehose": "3.369.0",
"@aws-sdk/client-sqa": "3.423.0",
"@aws-sdk/credential-providers": "3.503.1",
"@aws-sdk/node-http-handler": "3.74.0",
Is actually requesting four different versions of the SDK from the AWS internals. The AWS SDK v3 is modularized also internally, it consists of many smaller packages for utilities like retries, authentication, marshaling etc. Using 4 different versions of the AWS SDK clients meant that internally they couldn’t reuse their own dependencies. A later call to a different version means that AWS can’t reuse the internal package that had already been fetched.
It turned out that setting all these versions to be the same version significantly reduced our startup times.
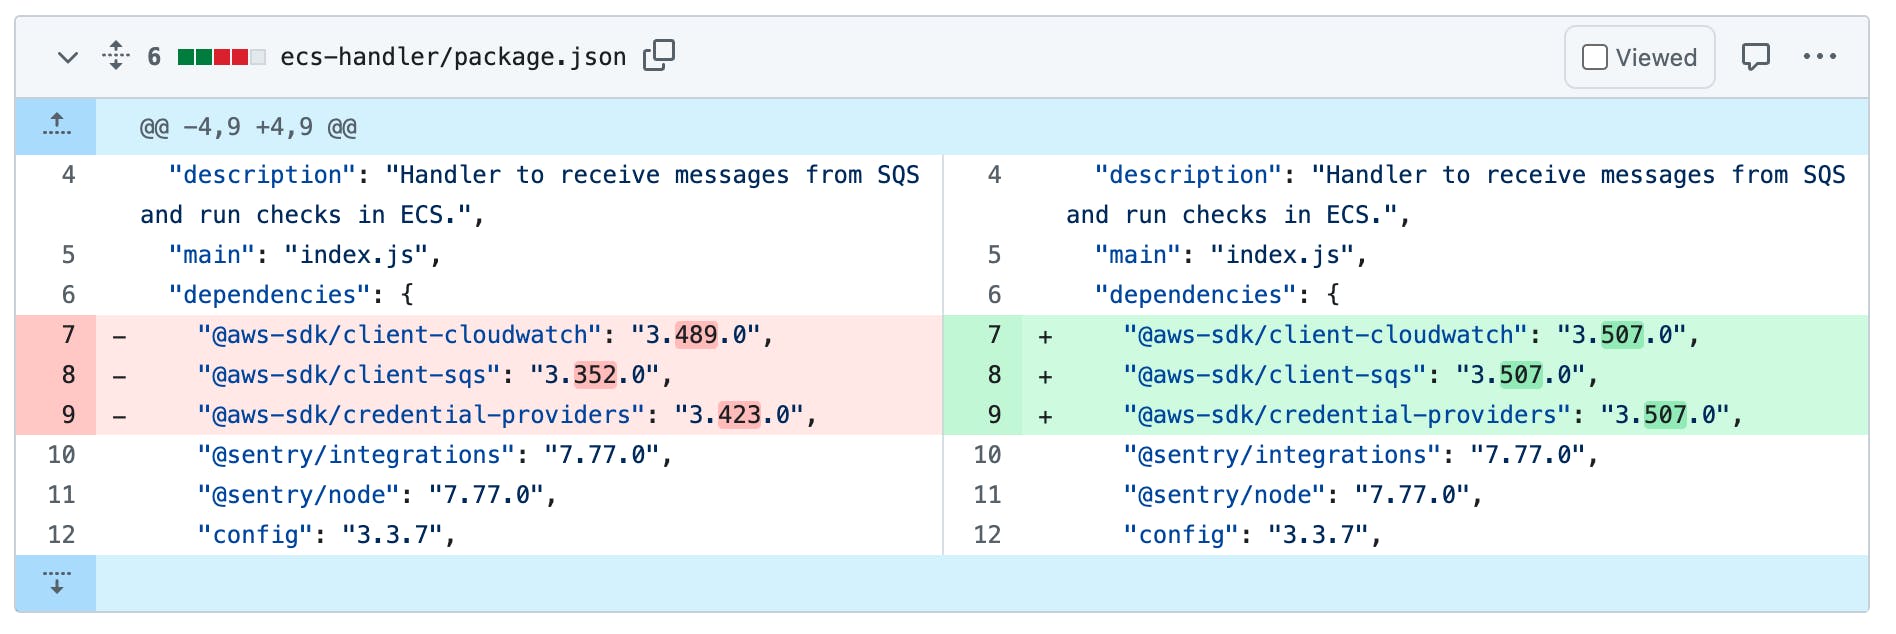
This simple update drastically reduced our startup times.
300 milliseconds == a whole lot of cost savings
Once the changes were deployed, we had this beautiful graph to look at.
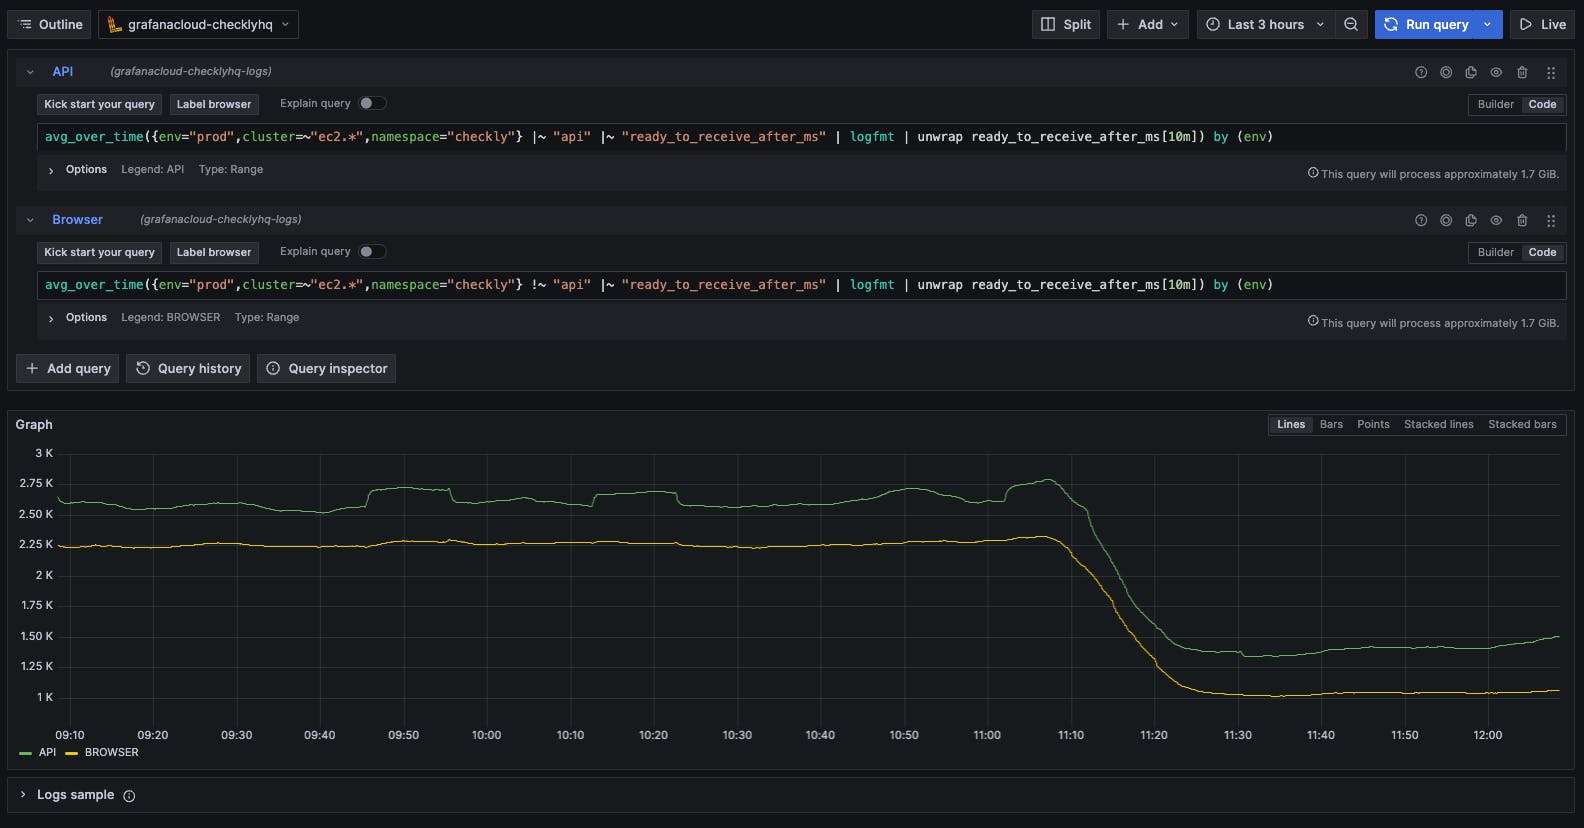
Pods were ‘ready to receive’ in about half the time they took before, saving about 300ms at startup. What effect did this change have on our bottom line? When pods aren’t ready to receive requests, we start up more ephemeral pods to handle the workload. The shortened startup time added up quickly, and soon we were running about 25% fewer pods than before the change. The resultant savings were about $5.5k per month.
It’s truly outstanding how changing a few version numbers in a package.json could save thousands of dollars every month, but the real story is how a combination of observability techniques can reveal root causes in surprising places. If you take the time to engage your curiosity you’ll find efficiencies in surprising places, even the way you require SDK’s.
Coming in Part 2: anti-patterns and the exception that proves the rule
In the second half of this article I talk about the second optimization that further reduced our startup times, and why rules are meant to be broken (sometimes). Want to know when new pieces are published? Join the Checkly slack and we’ll send you an update!