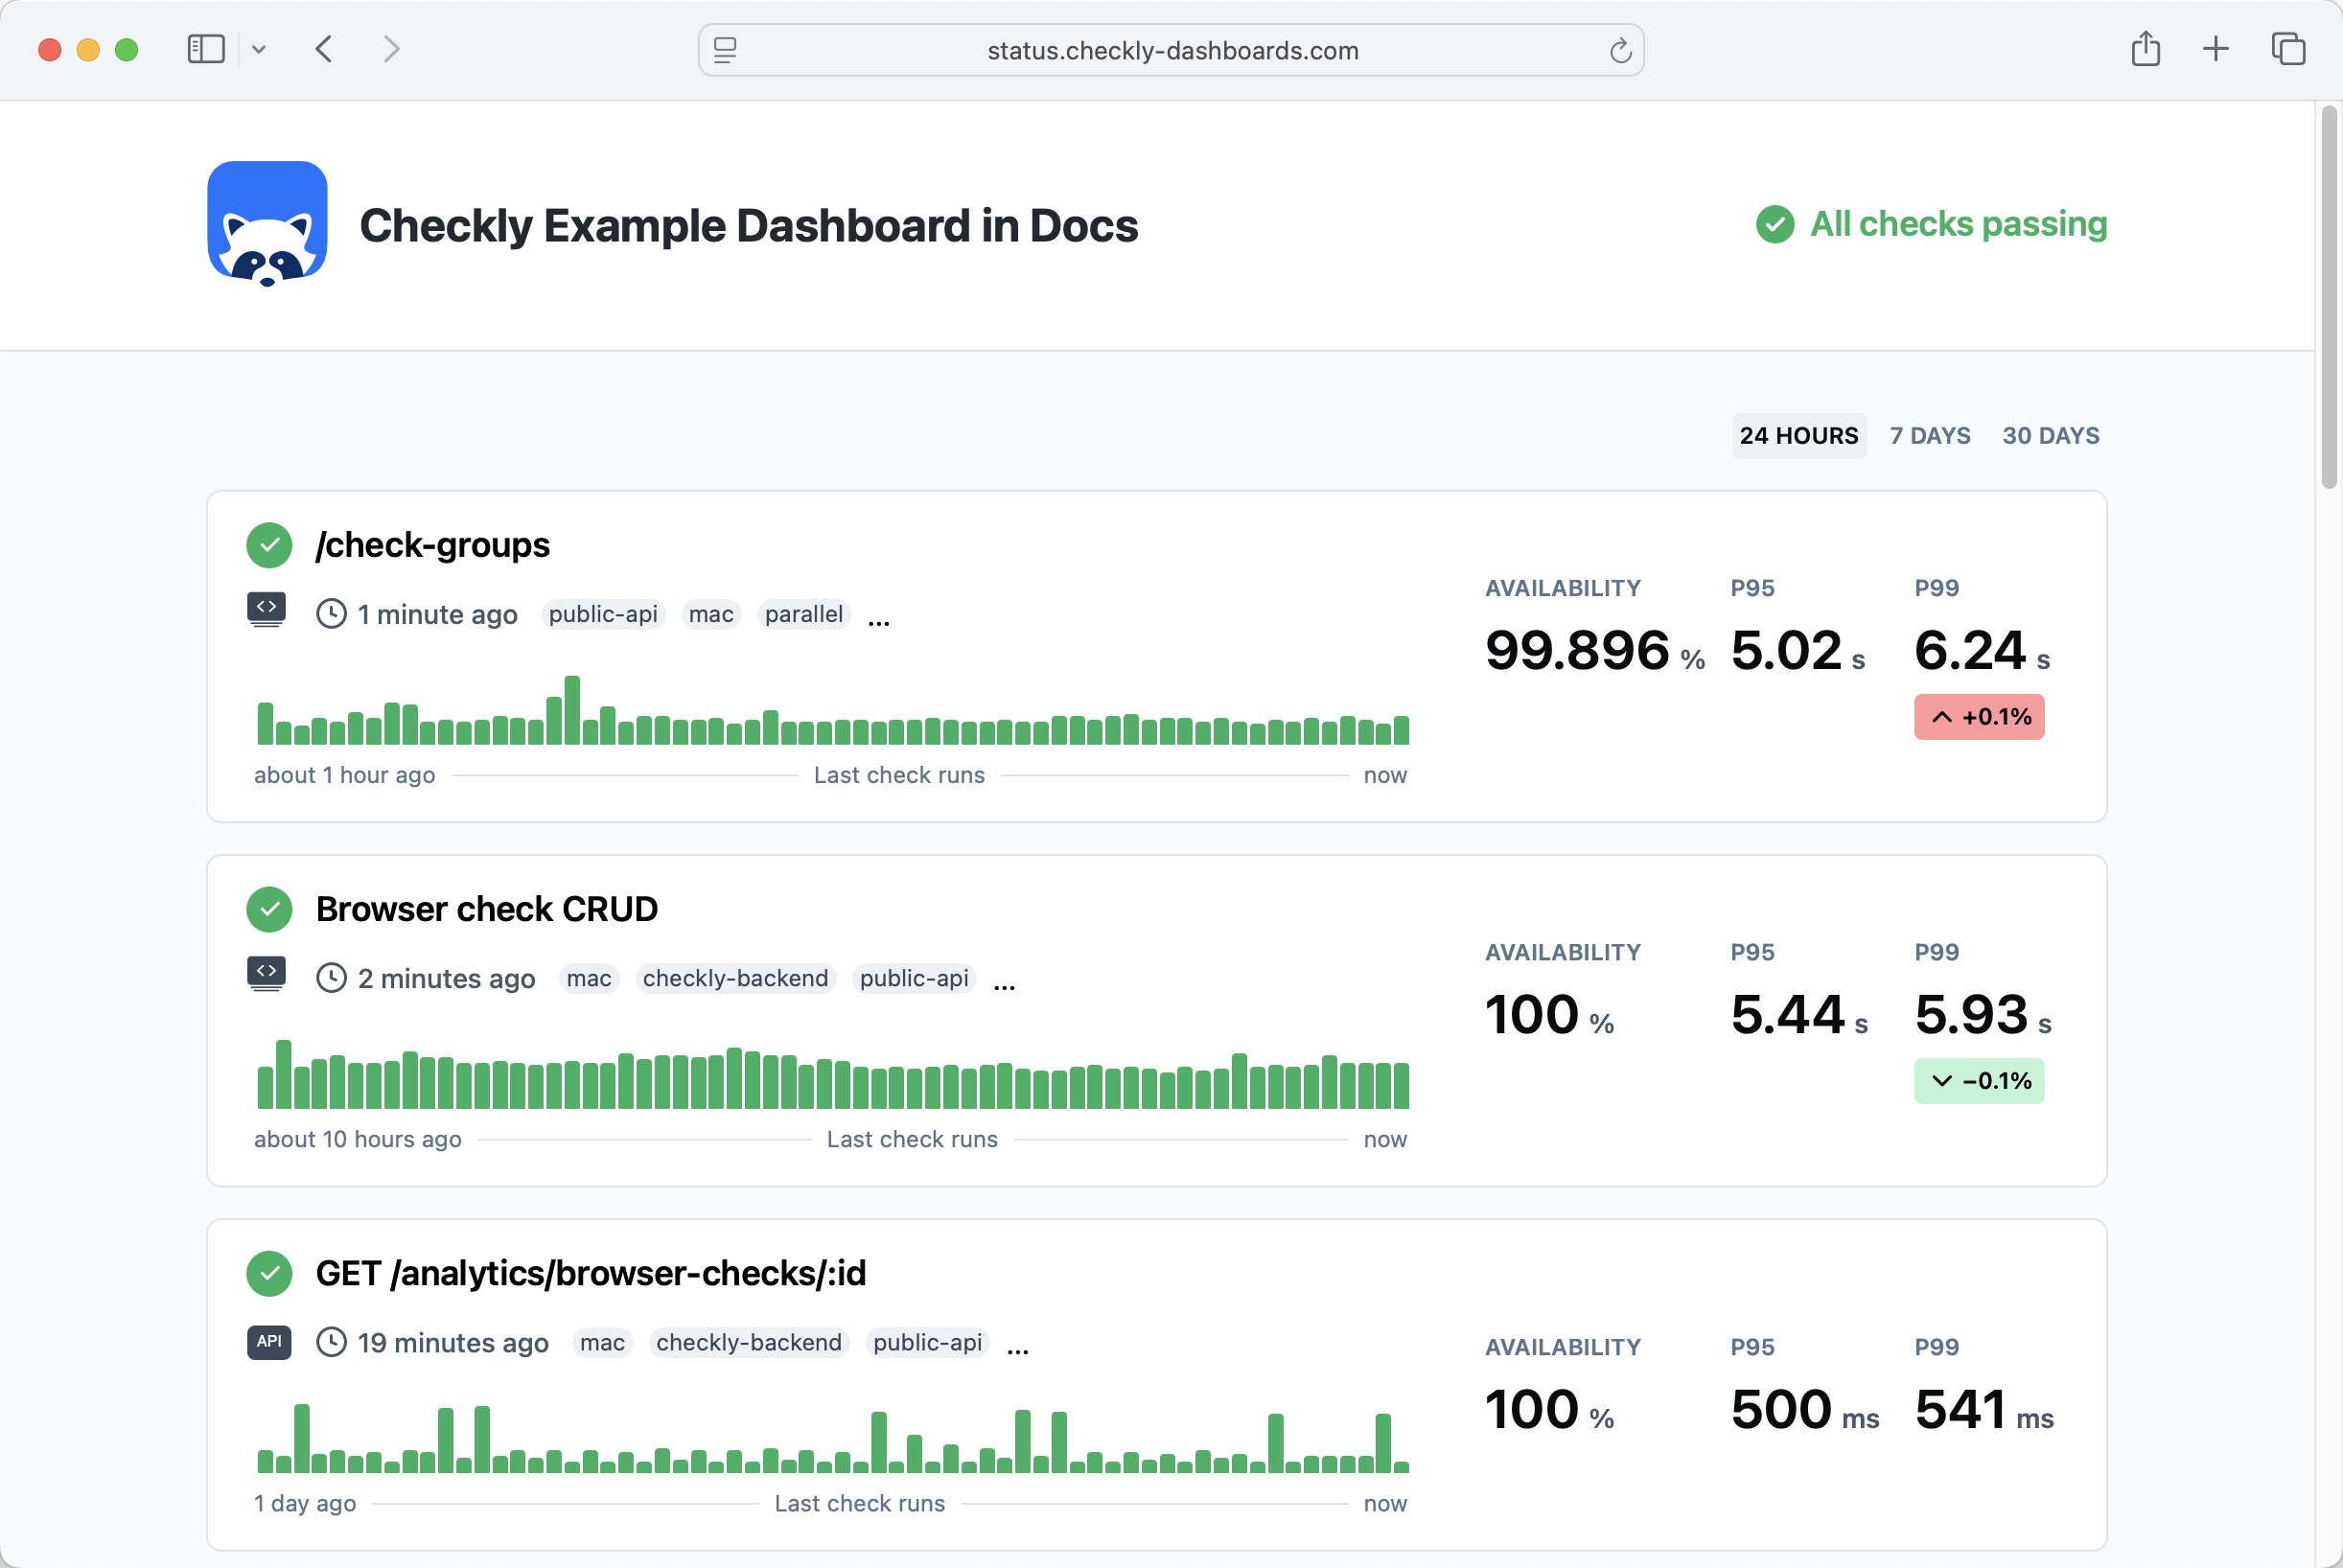
- Show the status of all your checks, or a subset by filtering by
tag. - Show the availability and p95 / p99 metrics over the last 24 hours, 7 days and 30 days.
- Communicate custom incident messages and maintenance messages.
Available metrics
Dashboards show the following metrics, depending on the check type:| Metric | Description | Supported check types |
|---|---|---|
| Availability | Percentage of successful runs | All check types |
| P95 | 95th percentile response time | All check types except Heartbeat & ICMP |
| P99 | 99th percentile response time | All check types except Heartbeat & ICMP |
| P95 Latency | 95th percentile ping latency | ICMP |
| P95 Loss | 95th percentile packet loss | ICMP |