Inspired by Infrastructure-as-Code and E2E-Testing
Historically, IT infrastructure has been provisioned manually, both on premise and in the cloud. This presented several challenges, including fragmented workflows, lack of transparency and scalability issues. In response to these problems, the last few years have seen a shift to the Infrastructure-as-Code (IaC) paradigm, in which large-scale systems are declared in configuration files as code. A new generation of tools has emerged to serve this use case, the most notable example of which is HashiCorp Terraform. Terraform provides a CLI workflow allowing users to specify what the final infrastructure setup should look like, and then takes care of all the intermediate steps needed to get there. E2E testing evolved similarly during the last decade during from proprietary algorithms living in tools like HP Quality Center to open-source-based code hosted in your repository next to your application code. Today, cross-functional DevOps teams continuously run automated E2E tests in their CI/CD pipeline instead of isolated QA teams testing new versions of your app for three months before release.Monitoring as integral part of your SDLC
Setting up monitoring can present some of the same issues as provisioning infrastructure or testing. This becomes apparent when we move past the initial rollout or proof-of-concept and onboard multiple products and/or teams, and see our monitoring setup rapidly grow in scope - along with its maintenance needs, that is. Monitoring as code learns from IaC, Unit testing and E2E testing and brings your monitoring close to your development workflows. How? By having it defined as code, much like you would do with any kind of End-to-End tests.Why Monitoring as Code with the Checkly CLI
What does one gain when moving from a manual to a monitoring as code approach? The main advantages of the Checkly CLI are:- Unite E2E testing & monitoring in one workflow. No more silos between Dev, QA and Ops.
- Programmable, testable, reviewable. Works with your dev pipeline. From your IDE, via PR to CI.
- Native @playwright/test support. No lock-in, just write standard *.spec.ts files.
- Alerting baked in. Set alerts for Slack, SMS and many more channels.
- Typescript-first. Fully typed for a stellar developer experience with code completion.
- Run in the cloud or on-prem. Run on the Checkly cloud or in your network using Private Locations
Monitoring as Code with Checkly
Users who have already used Checkly will be familiar with creating Checks, Check Groups, Alert Channels and other resources through the Checkly UI. Creating, debugging and managing E2E and synthetic monitoring at scale is best done “as code”. Currently, Checkly supports three tools you can use for your monitoring as code (MaC) workflow:Monitoring an e-commerce website - as code
How does this all look like in practice? Let’s find out by creating a small monitoring setup for our demo e-commerce website.Setting up the Checkly CLI
A quick way to bootstrap a new project with the Checkly CLI is to run the following command.Terminal
- Login
- Search
- Checkout
login.spec.ts
create-project
create-checks-directory
login.spec.ts.
…install playwright
install-playwright
install-checkly-cli
install-typescript-dependencies
checkly.config.ts file and include the basic Checkly configuration as follows:
- checkly.config.ts
checkly.config.ts
Terminal
run-tests
Deploy your first Checks to Checkly
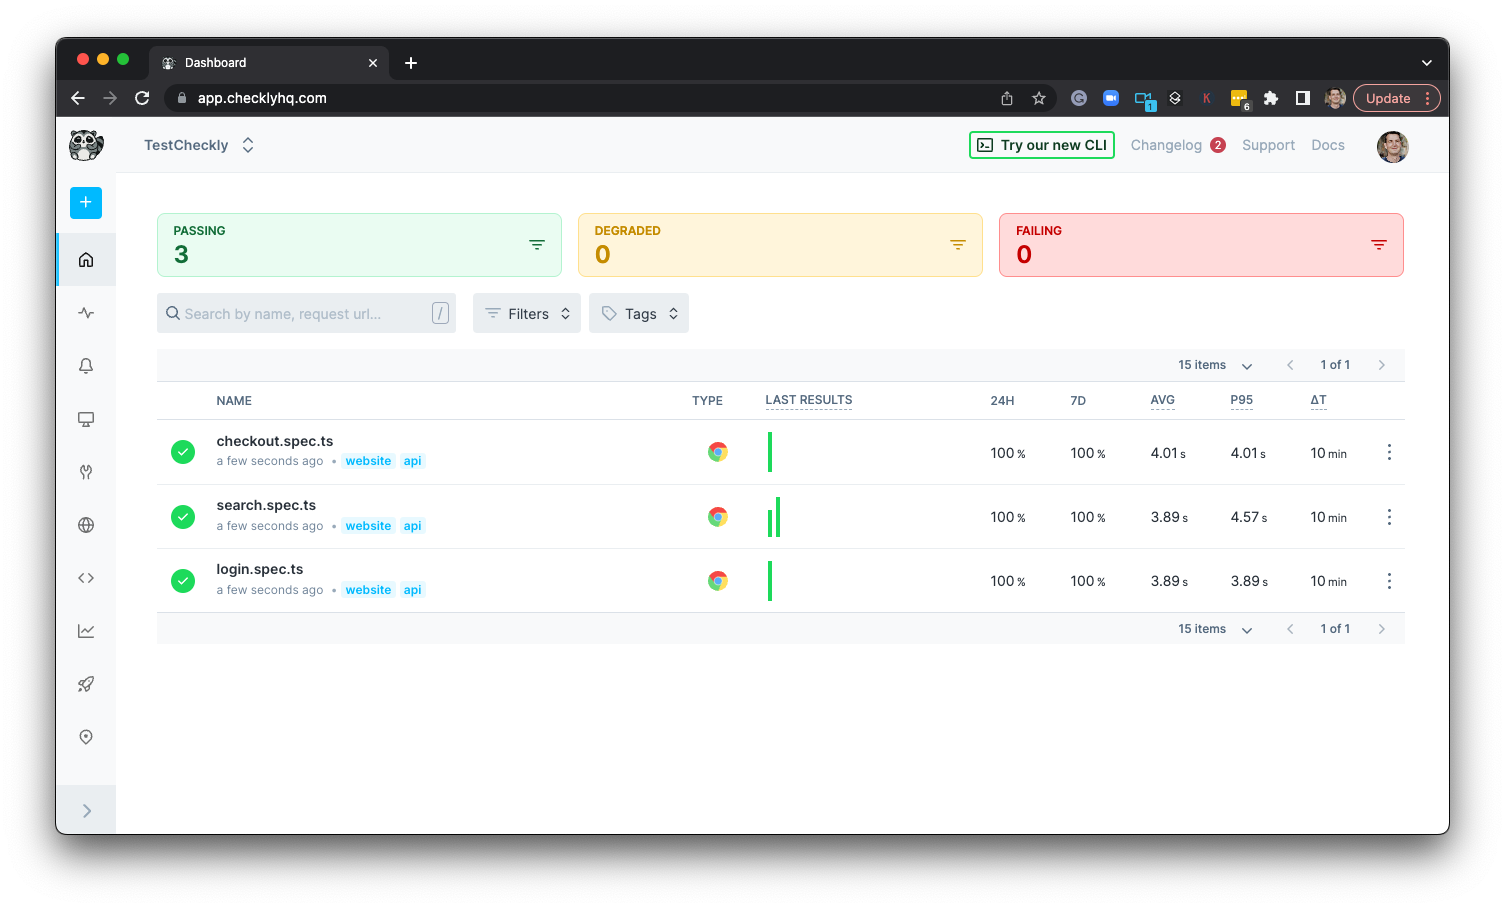
Now that our project has been initialised and we have added some resources, we can deploy our Checks by runningnpx checkly deploy.
The CLI will determine all the needed changes to be performed to replicate our monitoring code on Checkly.

Monitoring API correctness and performance
Browser Checks are now there to keep us informed on the status of our key website flows. What about our APIs, though? Whether they make up the foundation of our service or they are consumed directly by the customer, we need to ensure our endpoints are working as expected. This is easily achieved by setting up API Check resources.- API check resource
api.check.ts
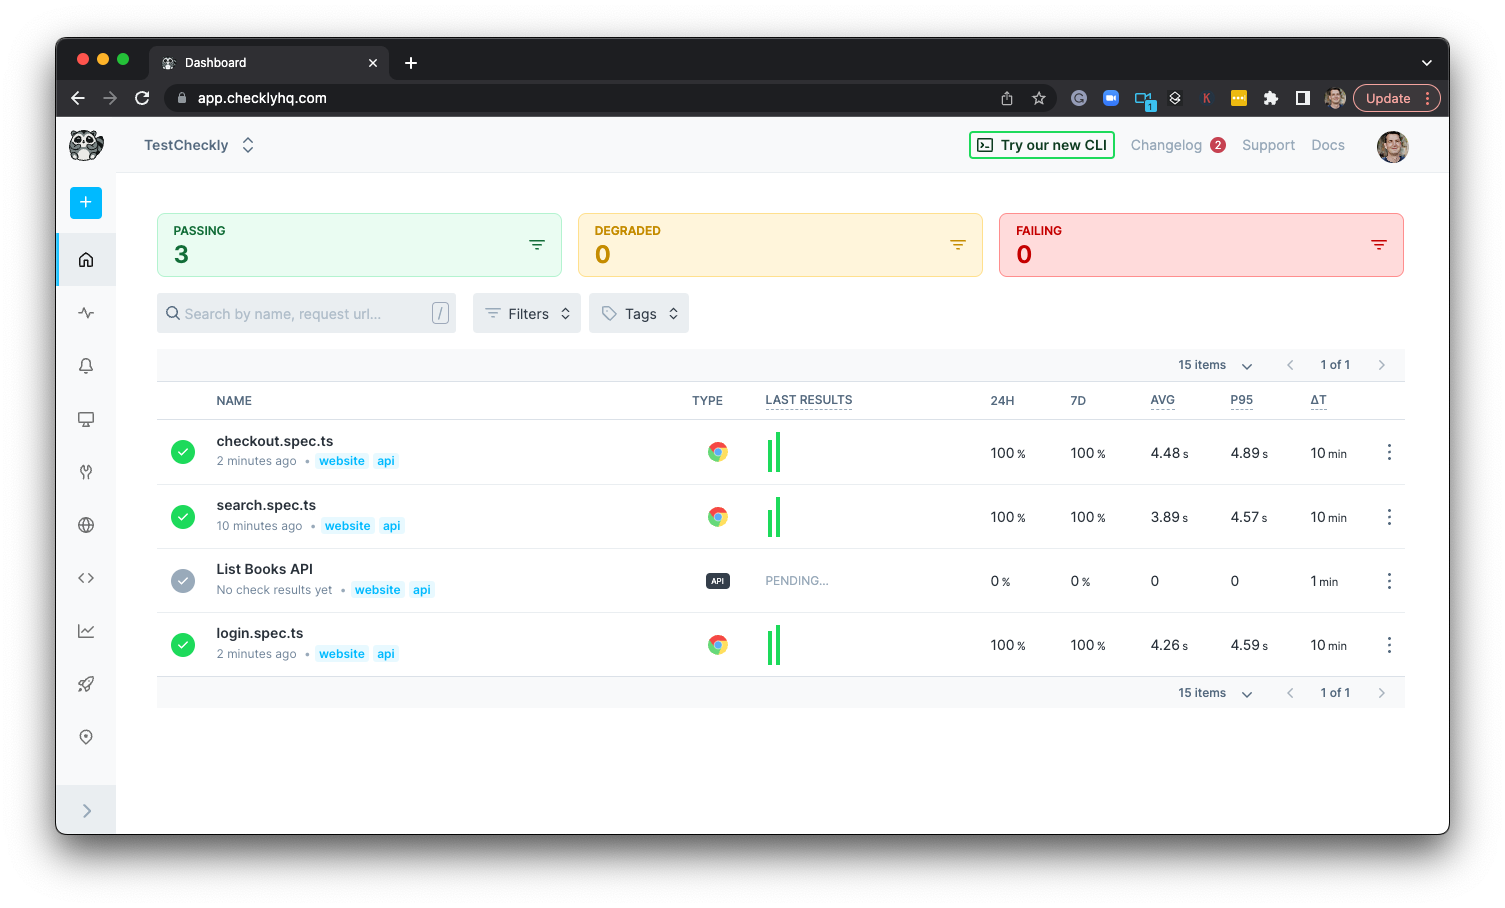
checkly deploy to see the new Check on Checkly:

Alerting
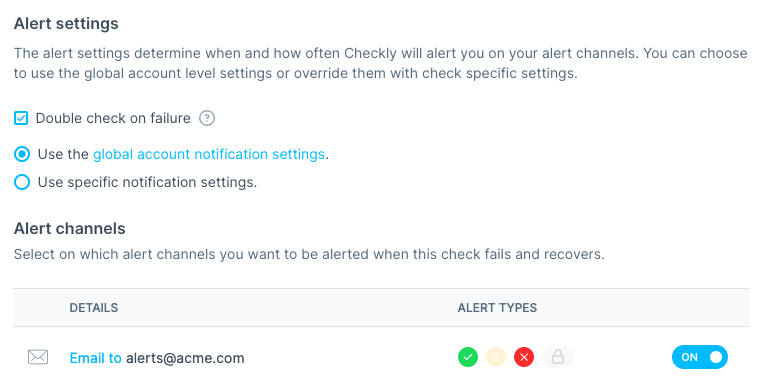
Now that we have our Checks in place, we want to set up alerting to ensure we are informed as soon as a failure takes place. Alert channels can be declared as constructs, just like the Checks. Let’s add the following to ouralert-channels.ts file:
alert-channels.ts
api.check.ts
checkly deploy will apply the changes on our Checkly account:

More on MaC with our CLI
Expanding our initial setup from here is easy, please follow these links if you want to know more:Read More
Monitoring as code
Why should the way we manage monitoring be any different?
End to end monitoring
Learn end-to-end monitoring with playwright to test key website flows.
Setup scripts for API monitoring
Setup scripts are a fundamental tool to tailor API checks to your own target endpoints.