The Problem: A Fractured Picture of Your Code
If you’re already excited about Playwright and/or Checkly, you probably don’t need much convincing that it’s good to use both to monitor more environments, if so feel free to skip this section. In short, we’re all aware that the software development life cycle (SDLC) often breaks down when it comes to finding bugs and solving outages.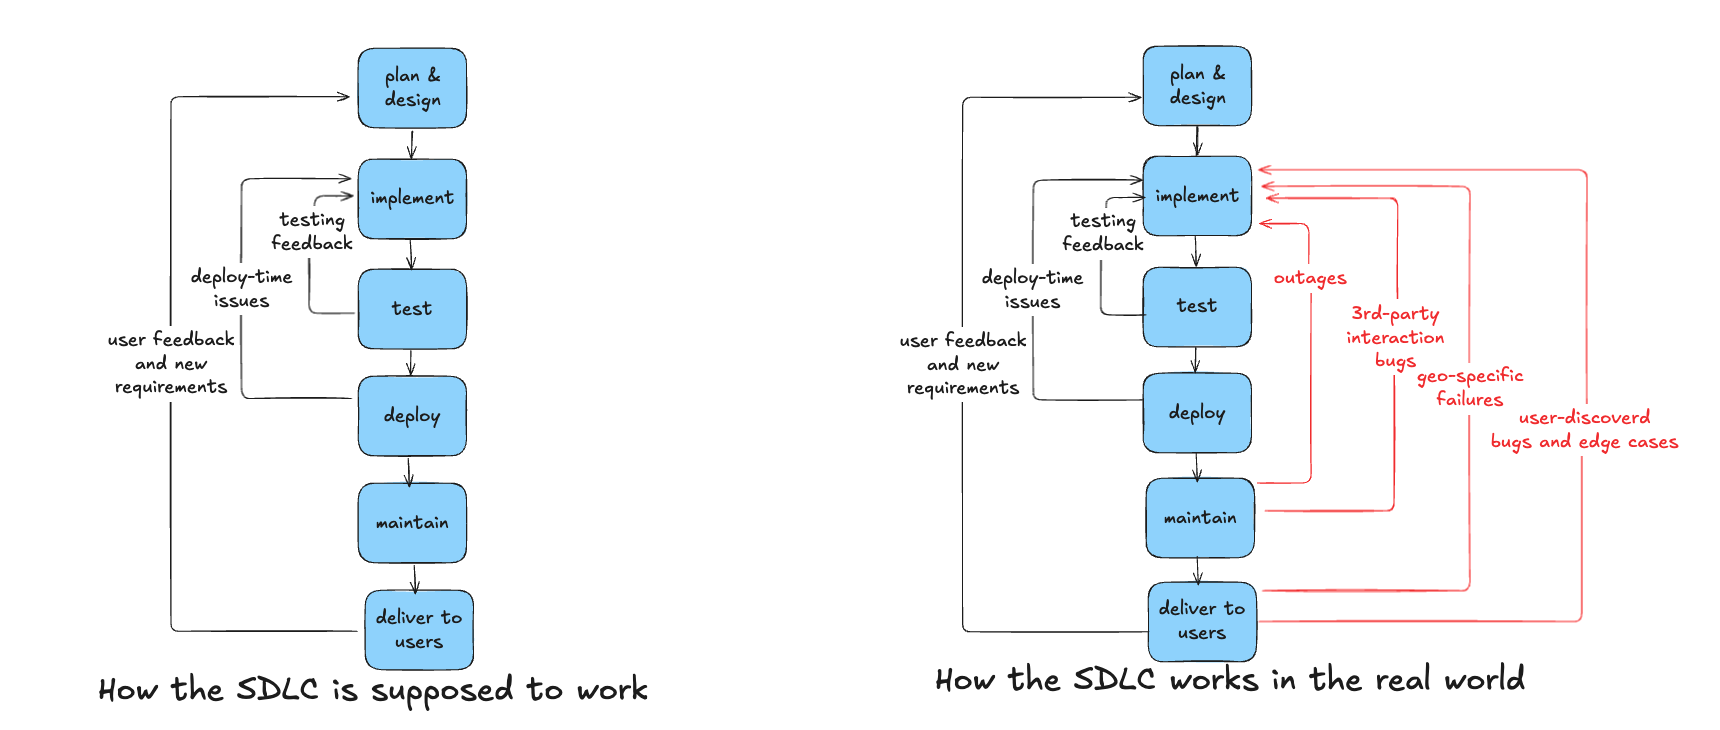
- When bugs are found post deployment, feedback is often given without full context, with the first reports going to someone other than the developer.
- Any fixes have to be delivered out-of-band of the normal development cycle, either coded in haste during incident response, or written and deployed during time that was supposed ot be spent on new features.
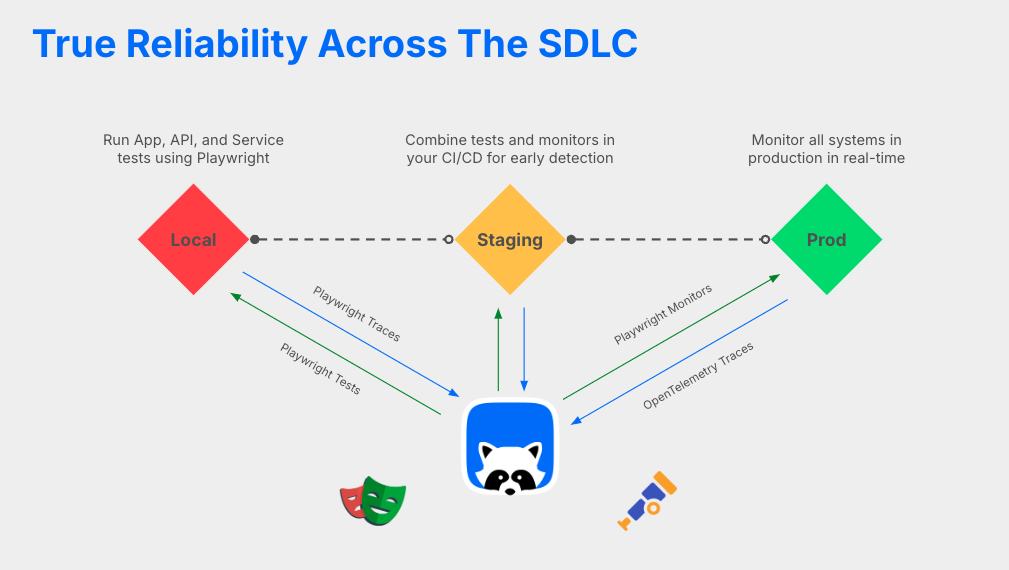
The Solution: Unified Checkly & Playwright Monitoring
Why do we need to test after staging? After all, if a bug gets through to production, it just means we need to do more testing and better testing before production right?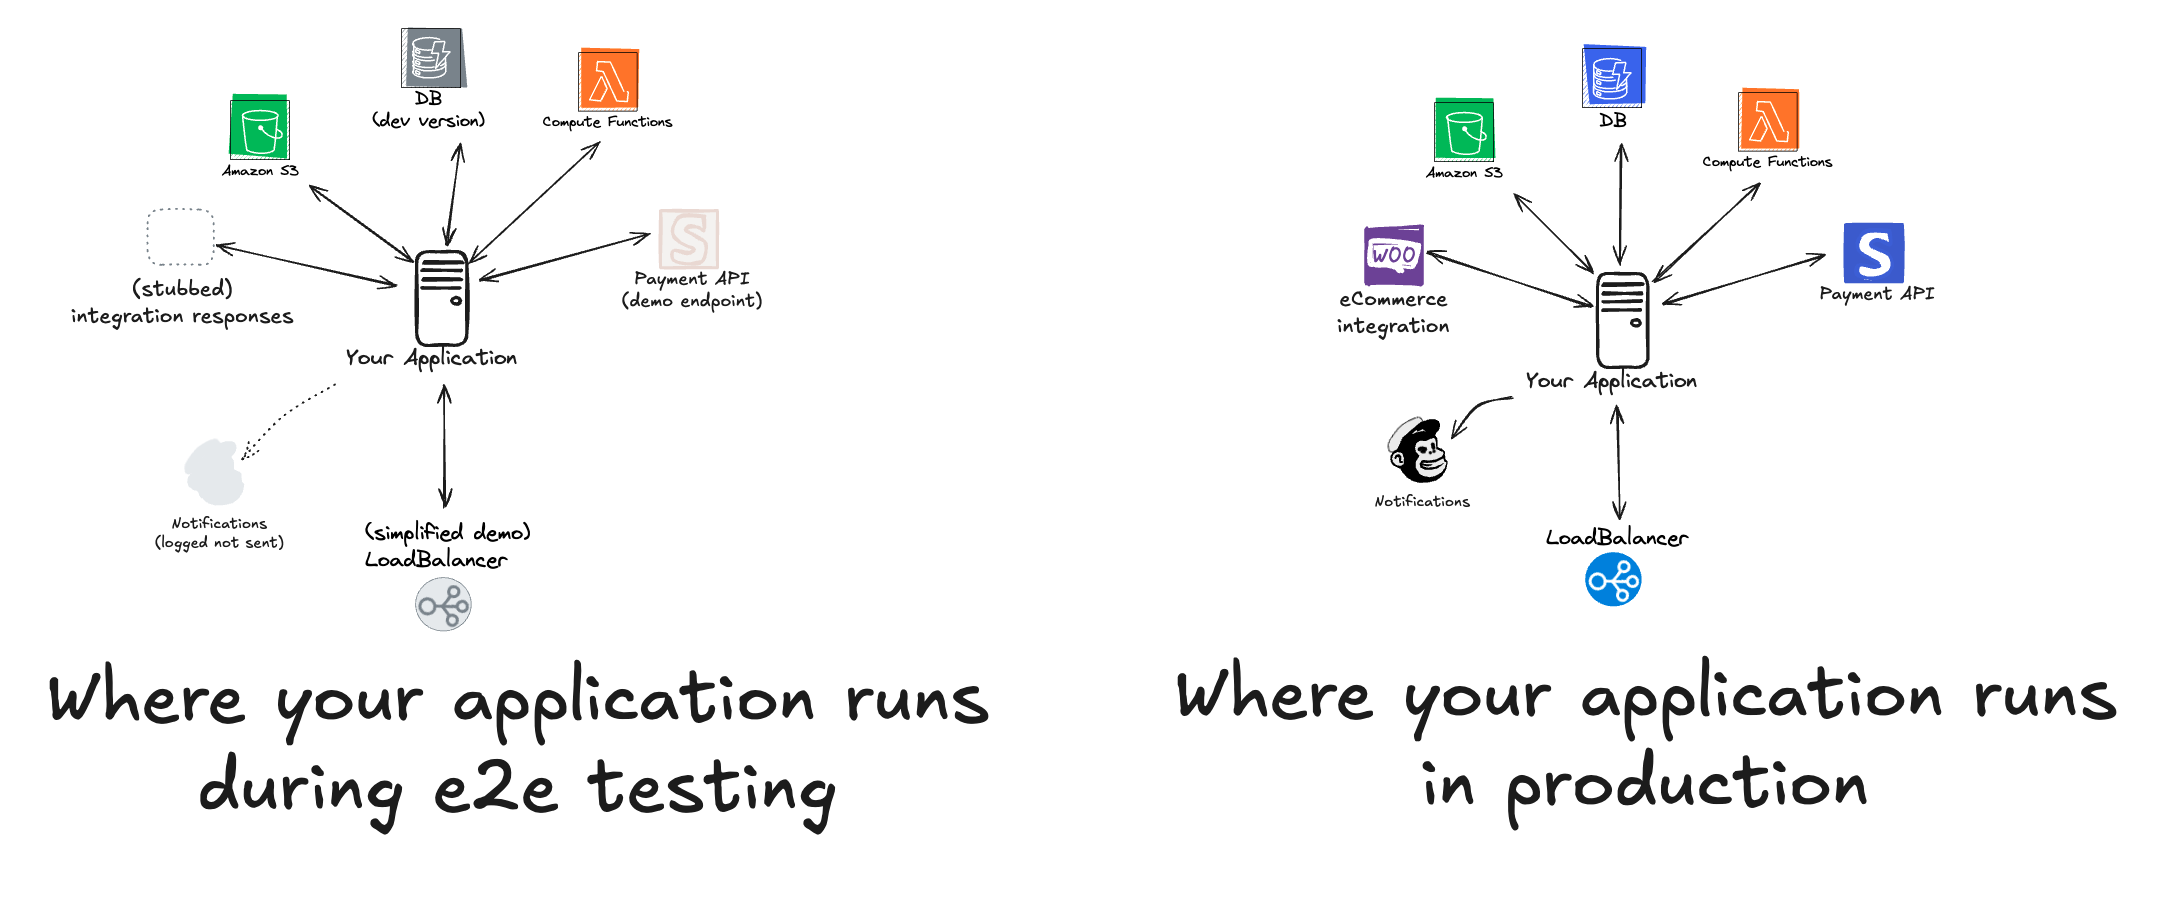
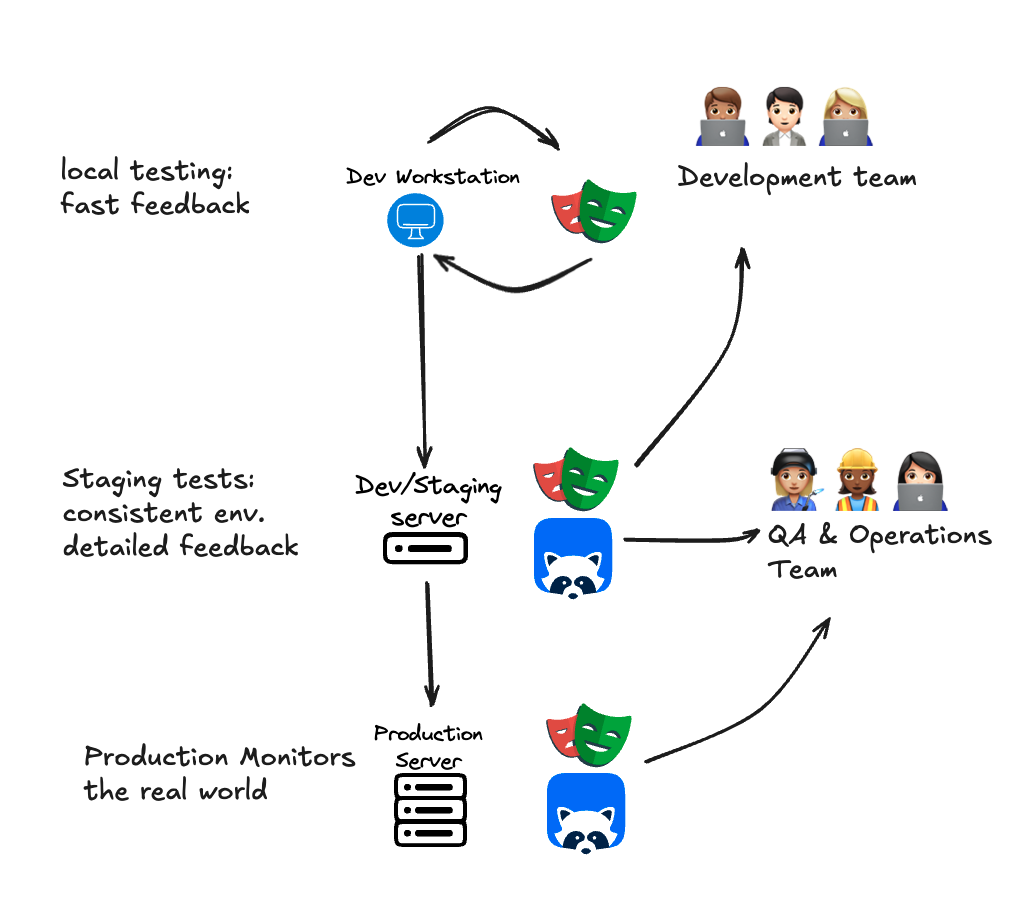
1. Local testing - Playwright on the laptop
In the first phase, our test build is running on our local workstation, and we want test feedback as quickly as possible. The few seconds it takes to run a basic Playwright test might be the most time acceptable, if a developer is checking her test feedback every time she writes a few lines of code.Local testing with Playwright
The process starts with developers working with their test code at the same time they’re writing features. Some devs may use tests written by QA or other teams, and should make use test fixtures to automate repeated tasts within their Playwright tests.Example: Creating a Custom Fixture for Logging In
Let’s say you want to log in to your application before running a set of tests. Instead of repeating the login code in every test, you can create a custom fixture that handles the login process. Step 1: Define the Custom Fixture Create afixtures.js file to define your custom fixture. This fixture will extend the base test object provided by Playwright.
Playwright.test.ts
test object from fixtures.js and write your tests as usual.
Playwright.test.ts
With test fixtures you can share test code across your team, saving them time as they write local tests.
Test your laptop from all over the globe with the Checkly CLI
After you’ve done the first extremely-high-speed iterative testing while writing new code, you may want to see how your local build handles requests sent from one or more real-world locations. This would require that your build is available to the internet either through a dev server or a reverse proxy tool like ngrok. With Checkly you can write your Playwright tests and then run them through the Checkly system, running your test from multiple geographic locations right from your local terminal with the Checkly CLI. After setting up your tests in a Checkly repisitory, a simplenpx checkly test will run your Playwright tests, not from your laptop but from the geographic locations defined in your checkly.config.ts file.
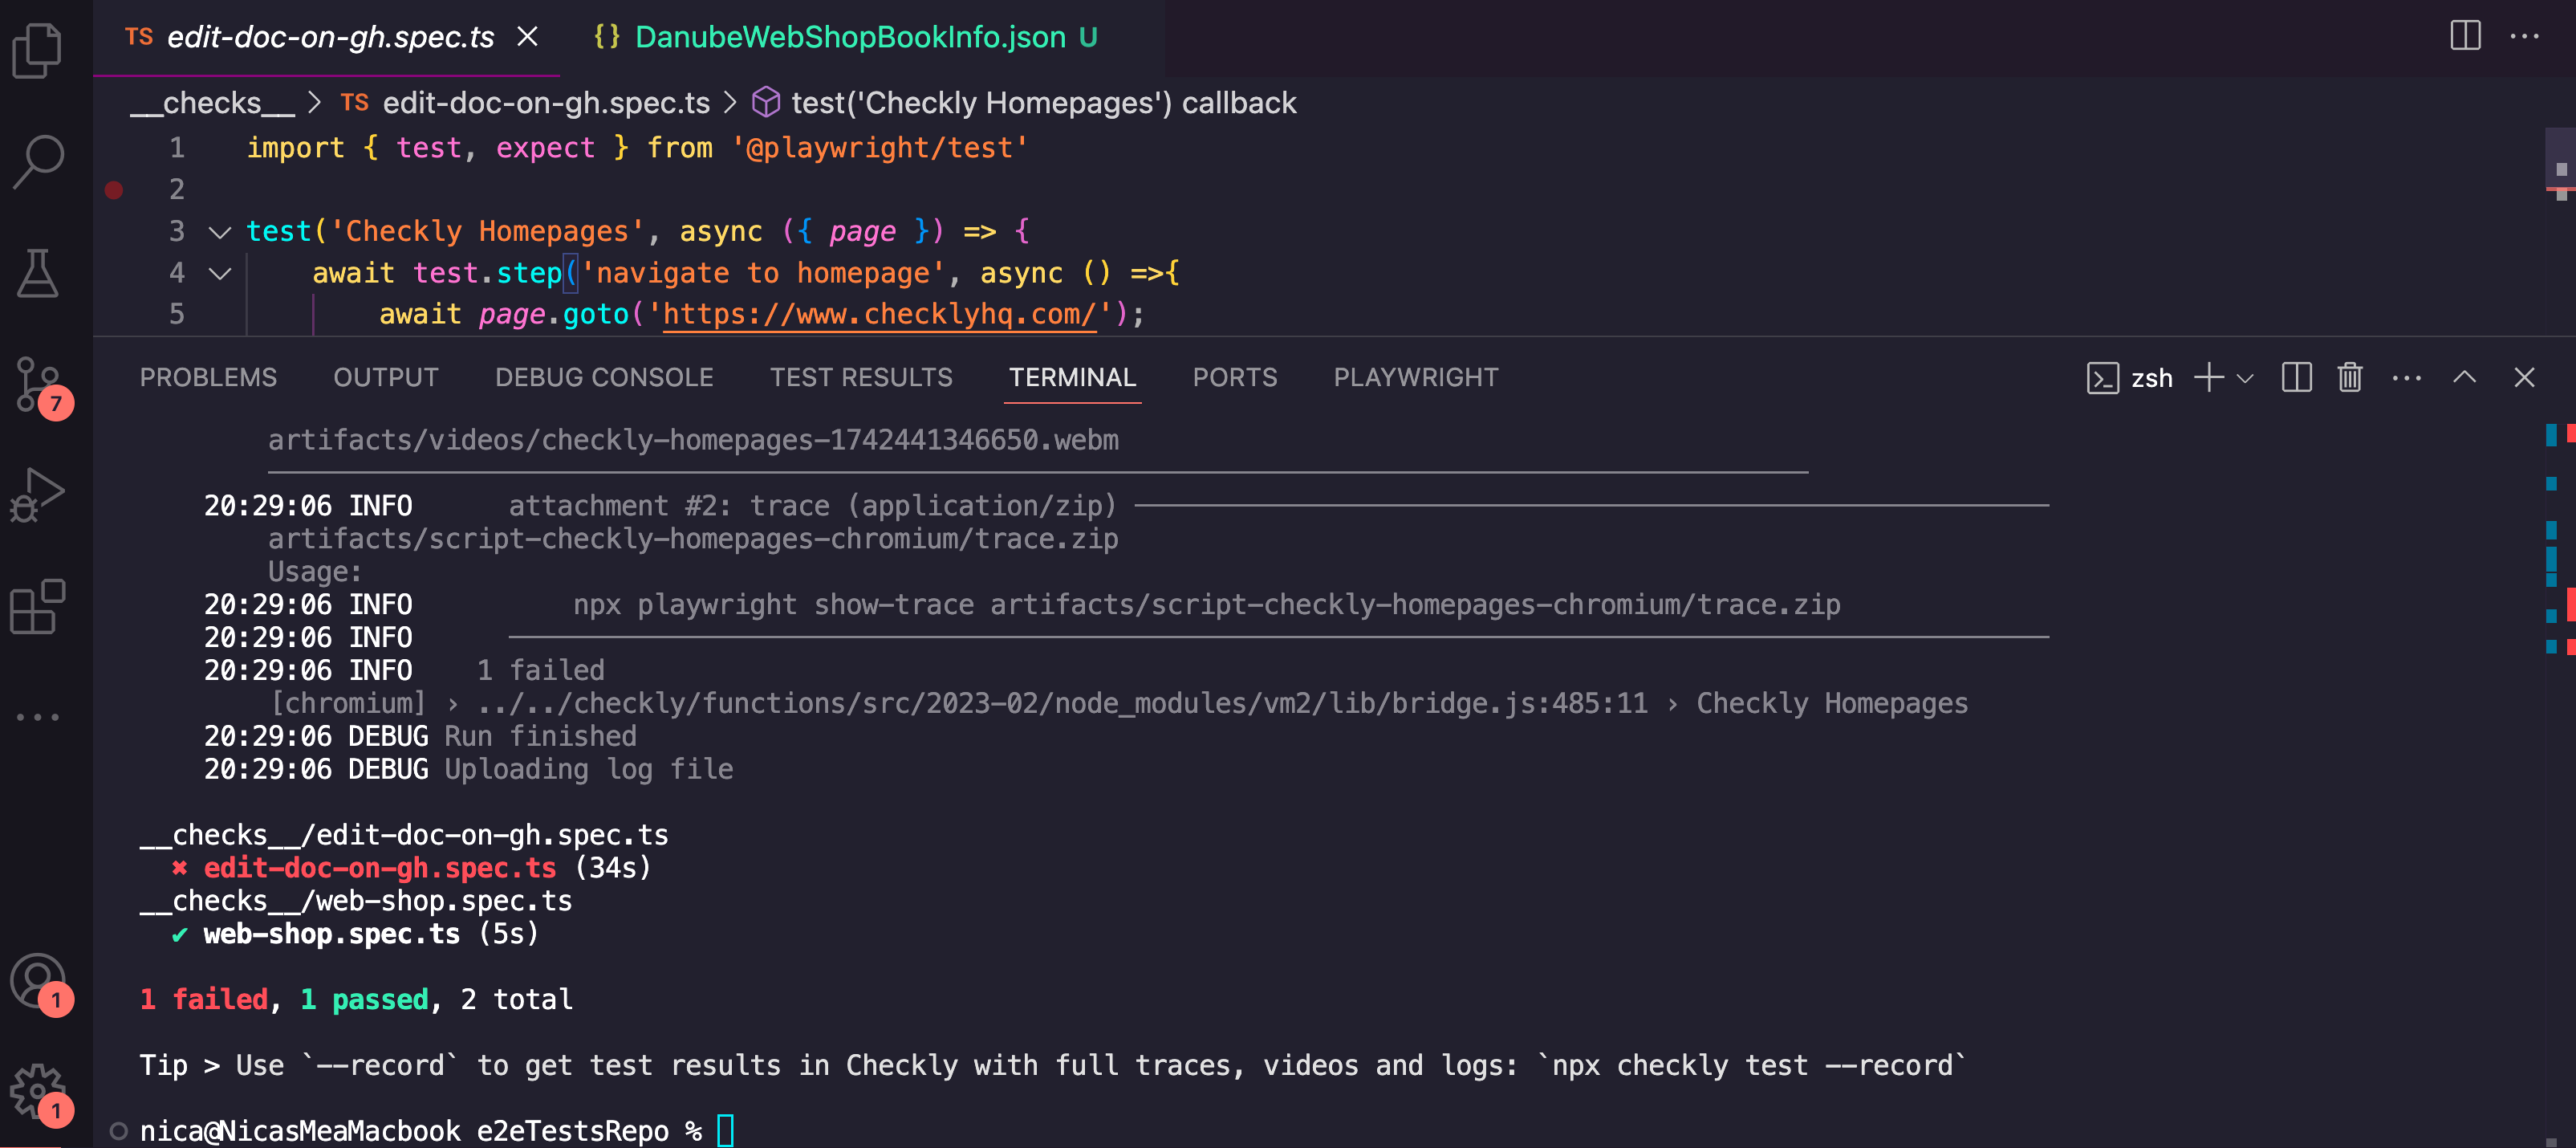
2. Staging - Monitoring pre-deploy code with Checkly
Once you’ve gathered code changes into a pull request, and the updates go on from your local or deve environments, it’s time to do some further phases of the testing pyramid, namely integration testing, contract testing, and e2e testing. With tests running on Checkly you get:- Tests run from real locations with full geographic coverage
- Consistent runtime environments - the same containers that run your Playwright tests against production will be used for staging tests
- Easily accessible results - use the Checkly dashboards to view test results and traces
Monitoring as Code
This guide can’t provide a complete tutorial of the monitoring as code (MaC) workflow, but in general this will look something like:- Write tests locally from a shared repository
- Update and expand your tests via source control
- Deploy from your shared repository to Checkly
- Manage configuration via config file in your repository
- integrate ad-hoc test runs within your CI/CD tools
Local Environment Variables
Local environment variables are used at build time. This means they are available when you run commands likecheckly test or checkly deploy. These variables are tied to your local environment, whether it’s your laptop, or a CI/CD pipeline.
Example:
Imagine you have an email alert channel in your Checkly setup. You can define the email address using process.env in your code:
Terminal
raccoon@checklyhq.com) instead of the default value.
Remote Environment Variables
Remote environment variables are used at runtime in the Checkly cloud. These variables are accessible when your checks (like browser checks or API checks) are running in Checkly’s infrastructure. Local variables won’t work here because the Checkly cloud doesn’t have access to your local environment. Example: Let’s say you have a browser check that visits a URL defined by a remote environment variable:SCREENSHOT_URL isn’t set remotely, the check will default to checklyhq.com. To set this variable in the Checkly cloud, you can use the Checkly CLI:
Terminal
https://docs.checklyhq.com).
Overriding Remote Variables Sometimes, you might want to override remote environment variables temporarily, like during a preview deployment. The Checkly CLI makes this easy with the
-e flag:
Terminal
SCREENSHOT_URL variable for that specific test run, allowing you to test different configurations without changing your remote settings permanently.
Optional: Private locations for running Checkly within your cloud
For enterprise users, you may want to run Checkly monitors from within your cloud. This is especially helpful if your API isn’t available on the public internet, or you want to run checks from a geographic location not covered by the Checkly system. If your development and staging locations are running on private clouds, a Checkly Private Location makes testing easier.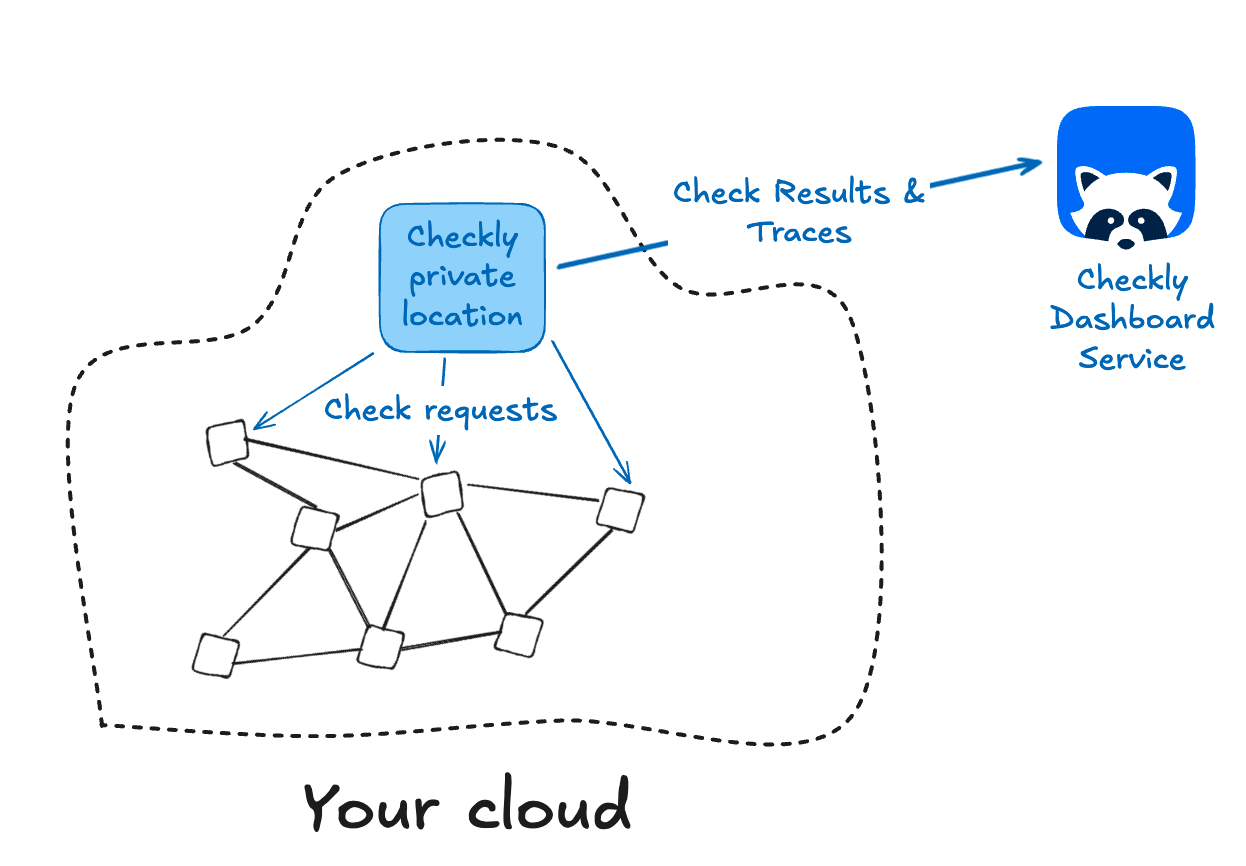
- A Checkly enterprise accounts
- A container runtime (we test using Docker, but other runtimes should work)
- Outbound internet access for the Agent to https://agent.checklyhq.com (proxy configuration is supported)
- Access to your API or browser-based applications and services from the Private Location network
Checkly Traces for OpenTelemetry insights
At any layer of running tests against your services, it’s helpful to connect the information from synthetic testing with backend trace data. With Checkly Traces, it’s possible to export backend data captured with OpenTelemetry and gather trace data from your backend services as they’re handling the requests sent during a Checkly Test. Implementation is straightforward and results in a highly efficient observability setup that doesn’t use bandwidth for unnecessary monitoring data. In most cases the setup will look like this:- Configure Checkly to send a header with its requests, which will be picked up and propagated by OpenTelemetry instrumentation
- Add a configuration to the OpenTelemetry collector to send only relevant traces to Checkly
- Enjoy information on database requests, compute time, third party requests, and other backend processes right in your Checkly dashboard
3. Production - Finding failures in real time with Playwright & Checkly
Moving to Production cadence
Once you’ve moved to production, it’s time to run your tests on a cadence, creating a monitor that tell you within minutes if any part of your service goes down. The process for setting this cadence looks like:- Determine the right check frequency based on SLA
- Configure your tests either in the web UI or by editing your test repository’s config file
- Group or tag tests by criticality to have consistent cadence for high value services - this also makes it easier to see checks together in the web UI
Alerting on failures
Finally, now that we’re monitoring production with Checkly, we’ll need to send alerts to an on-call team and/or key stakeholders when something is detected as not working. Checkly supports multiple alert channels, with configuration available either for a single check, at the group level, or all checks. Some best practices:- Configure retry logic for minimal alert fatigue - Checkly offers fine-grained retries on checks, and it’s important to double-check that failures aren’t transitory. Balance alert fatigue with time efficiency, as multiple retries can significantly impact time to detection.
- Don’t rely on a single alert channel, always have at least one backup like a slack message or email to make sure that a delivery failure doesn’t aggravate an outage.
- Use soft assertions and degraded states for more depth - not every behavior counts as total failure. For slowly-loading graphics or error messages that don’t block the user, use the degraded state to flag the problem without sending high priority alerts.