This is the seventh part of our 12-day Advent of Monitoring series. In this series, Checkly's engineers will share practical monitoring tips from their own experience.
At Checkly, we manage various scheduled jobs, some of which play a crucial role in our application's functionality, and others exist to support different teams within Checkly.
In this article, we'll break down how we use our own Heartbeat monitoring feature to monitor these scheduled jobs and catch issues before they reach out users.

Checkly Jobs
We maintain a group of jobs that serve different purposes. Two example categories are:
Infrastructure Jobs (Essential for the App)
- Sending Emails to Customers: Notifications for quota warnings, expired plans, weekly digests, etc.
- Database Cleanup: Tasks such as revoking support access or removing unused domains of deleted dashboards.
- Managing Database Partitions: Ensuring optimized and efficient database organization.
Internal Jobs
To empower the management and sales teams to monitor feature performance and make data-driven decisions, we've built a data lake that combines different data for ease of querying and access. To keep this data lake up-to-date, we created jobs that fetch information from different sources, including internal databases and third-party services.
Examples of these jobs include:
- Frequently fetching data from write-intensive tables.
- Daily scheduled data imports from Stripe.
- Data transformation jobs that aggregate and insert data into different tables.
Before implementing a monitoring solution, we would occasionally receive reports from the affected teams giving notice that the data is unavailable, inaccurate, or incomplete. This could potentially lead to decisions based on outdated information.
Therefore, it became evident that we needed a way to monitor these jobs in order to mitigate any potential issues as soon as a job run fails.
Our Jobs Monitoring Solution
Upon reaching the beta phase of the Heartbeat feature, we implemented checks to keep tabs on jobs that were previously not monitored. We also migrated some previously monitored jobs with Healthchecks.io to use Heartbeats as a unified service.
With Monitoring as Code, we created Heartbeat checks with the Checkly CLI. An example of these checks looks like:
import { HeartbeatCheck } from 'checkly/constructs'
import { slackChannel } from '../alert-channels'

new HeartbeatCheck('partition-management', {
  name: 'Partition Management',
  alertChannels: [slackChannel],
  period: 1,
  periodUnit: 'days',
  grace: 3,
  graceUnit: 'hours',
  tags: ['heartbeat', 'mac', 'database'],
})
The alert channel, period and grace units are chosen depending on the job frequency and urgency.
Heartbeat Pinging
Once checks are deployed, we receive a ping URL to call after each job run. For backend jobs on Heroku, we update the Run Command, including a Curl to the ping URL. For data lake jobs using AWS Glue, Python scripts are updated to make a simple request to the ping URL.
Example Heroku Scheduler Command:
run_job.sh && curl -m 5 --retry 3 https://ping.checklyhq.com/c2f5f5bb-6e46-431a-b7c1-35105450cddd > /dev/nullExample AWS Glue Python Script:
import requests

# Ping URL generated from the Heartbeat check
url = "https://ping.checklyhq.com/c2f5f5bb-6e46-431a-b7c1-35105450cddd"

# A GET request to the above ping URL
response = requests.get(url, timeout=5)
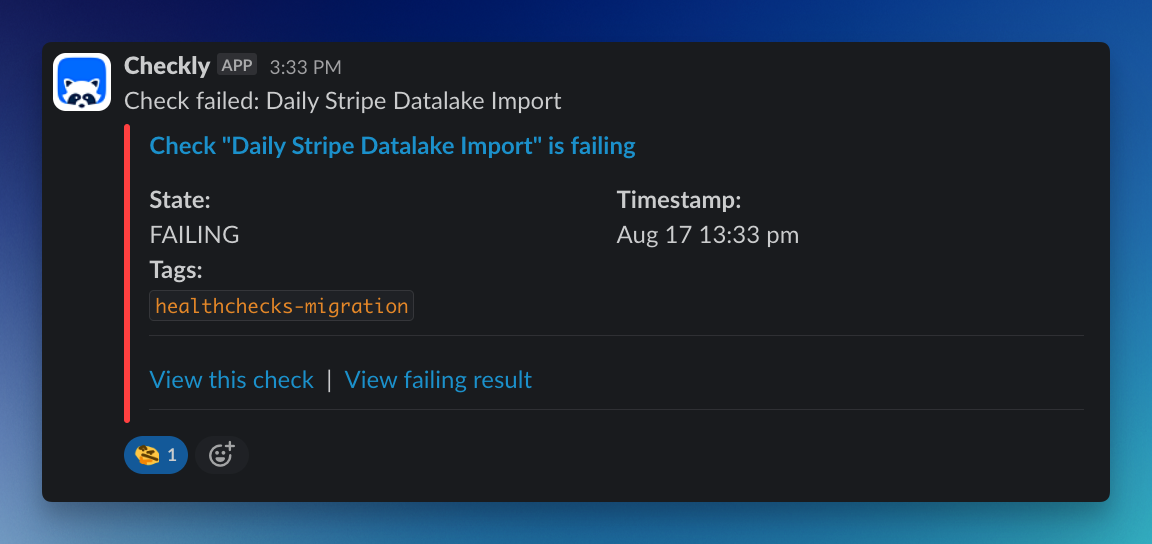
Once the check is set up, any missing pings (therefore failed job runs) on the expected interval will trigger a notification to the specified alert channel.
This is an example of an alert received on our data lake Slack channel when a Glue job failed.
By implementing Heartbeat checks to monitor our CRON jobs, we are now able to promptly handle any failed job runs, making sure our systems run as expected and all teams can work with up-to-date, trustworthy data.
To learn more, check our documentation or blog post.

