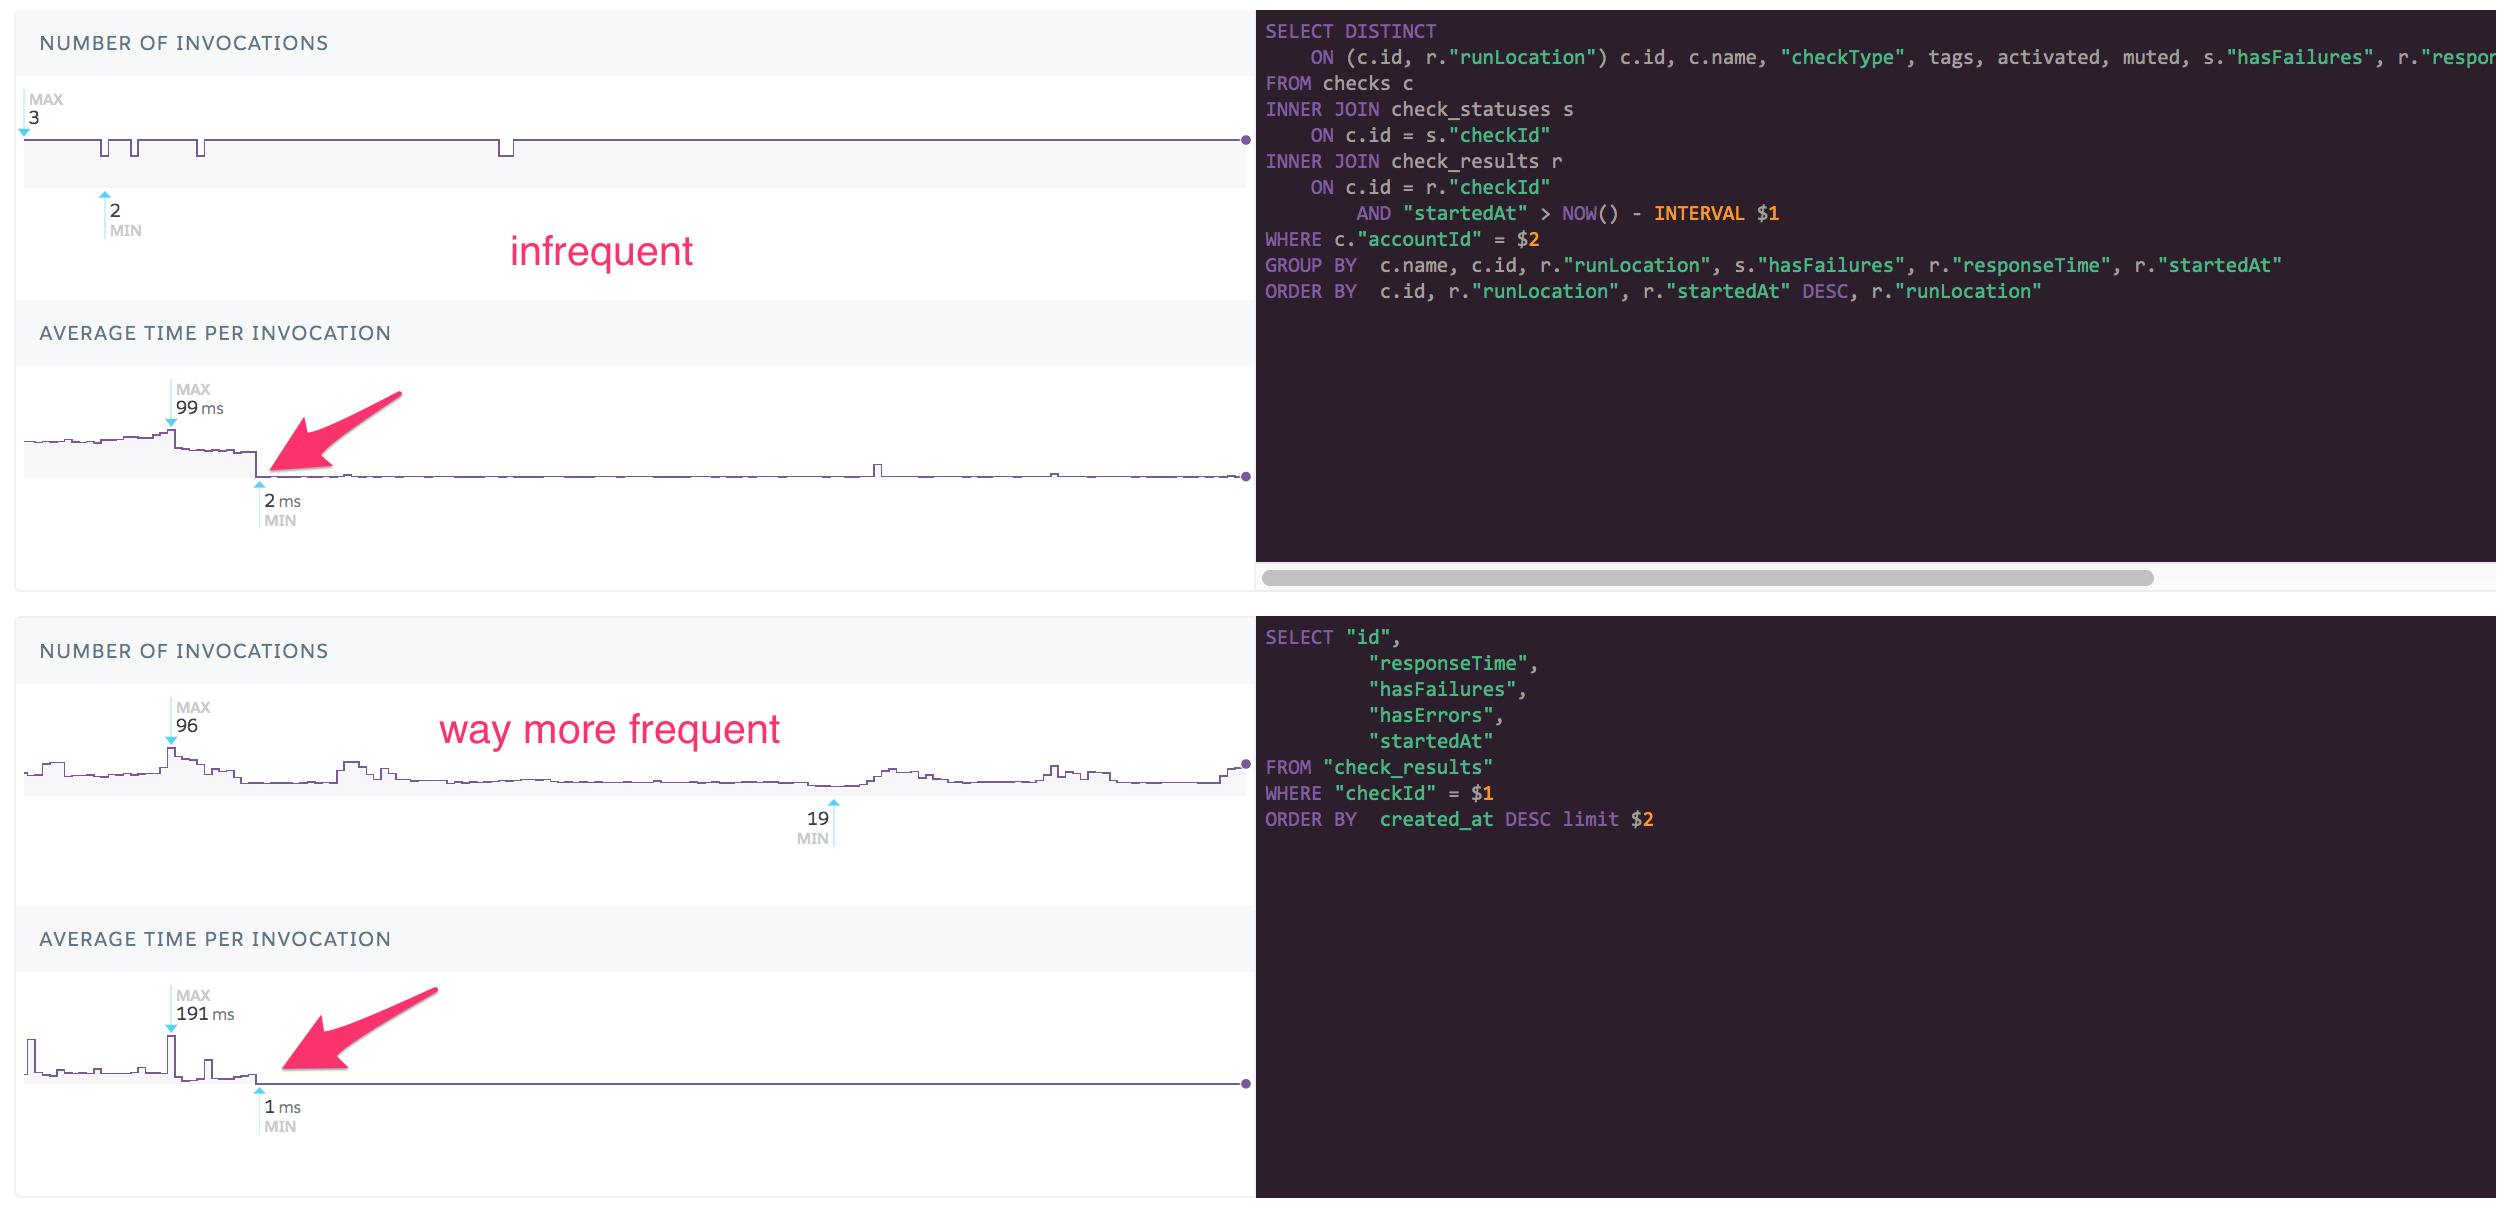
Last week I rolled out a simple patch that decimated the response time of a Postgres query crucial to Checkly. It quite literally went from an average of ~100ms with peaks to 1 second to a steady 1ms to 10ms.
However, that patch was just the last step of a longer journey. This post details those steps and all the stuff I learned along the way. We'll look at how I analyzed performance issues, tested fixes and how simple Postgres optimizations can have spectacular results.
The post is fairly Postgres Heroku heavy, but should work for other platforms too. Also, I can't believe I just used the word "journey" unironically.
Recognizing the pain
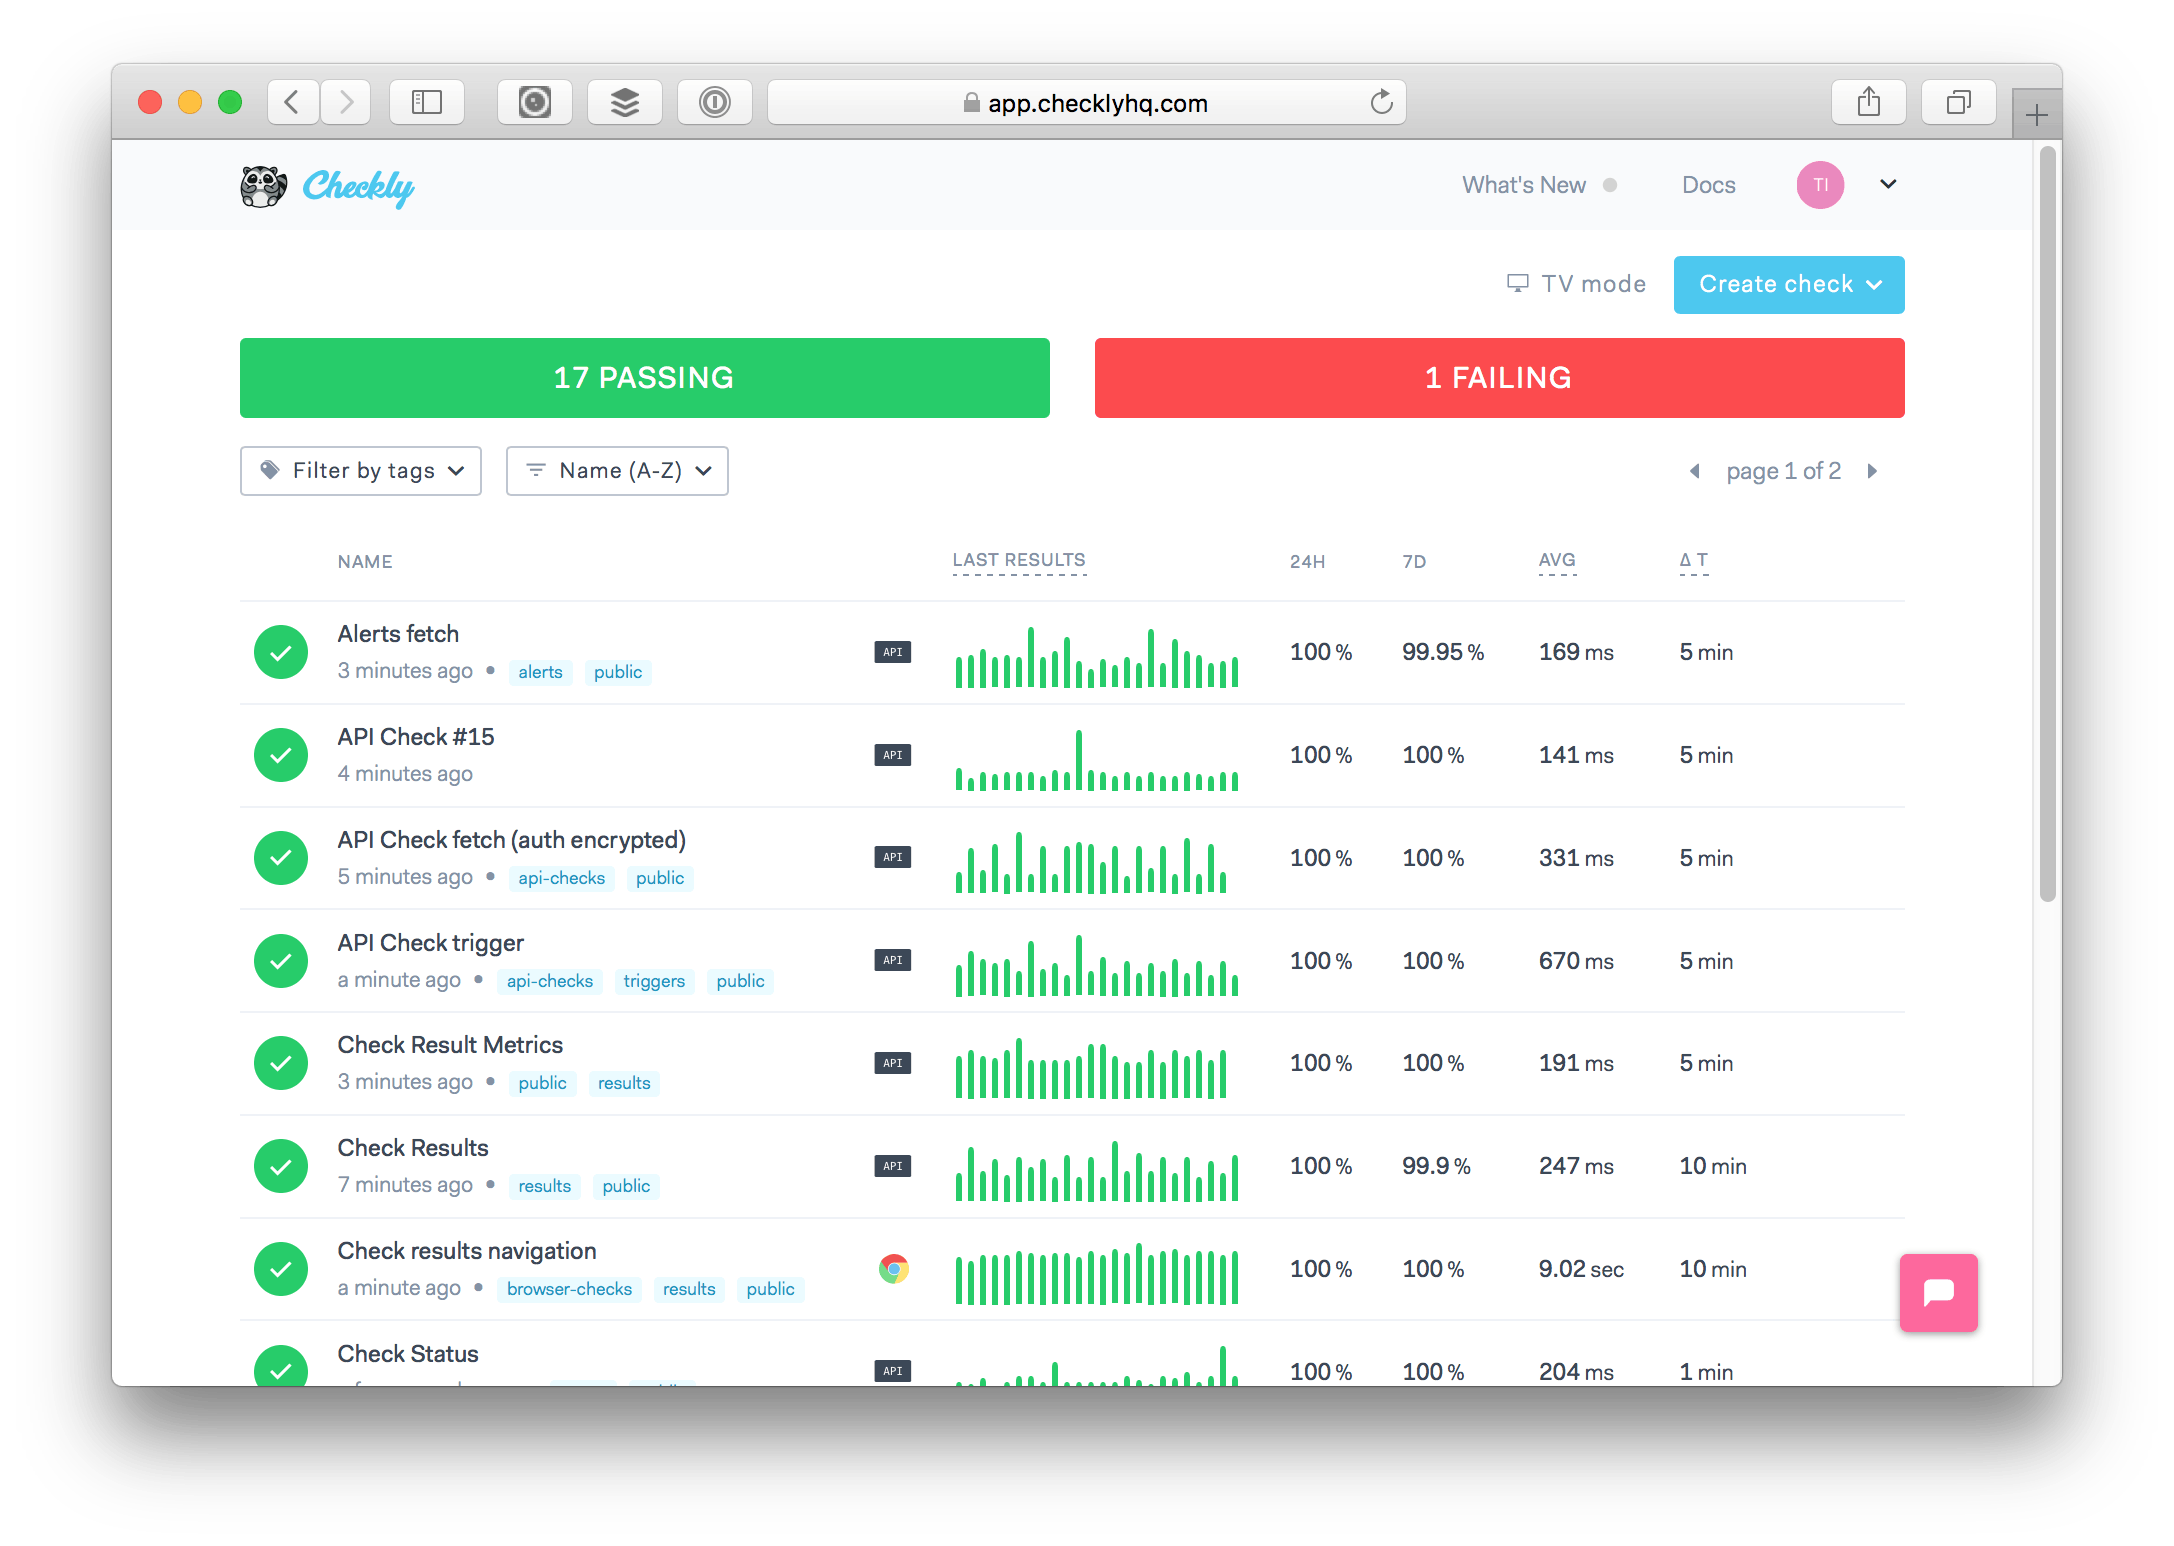
Deciding what parts of your app to optimize for performance can be tricky. So let's start at the beginning. Here's a screenshot of our own Checkly dashboard. This is what a typical user sees when he/she logs in, so it better be snappy.

The dash shows a bunch of checks, the last 24 results, the success ratios for 24 hours and one day and the average response times. All of these data points and metrics are in some way querying the check_results table: one of the most crucial tables in our Postgres backend.
To break it down, there are two important API requests on this dashboard that hit this table.
- /check-status is a bit of a weird one. It is a snapshot of the current failing/passing status and the various metrics like success ratios, p95 and average response times at the current time. For all checks! These metrics are calculated on the fly using, you guessed it, the
check_resultstable. - /results-metrics is more straightforward. It just returns an array of check result objects with most of the fluff stripped out. It has pagination and all the bits you would expect.
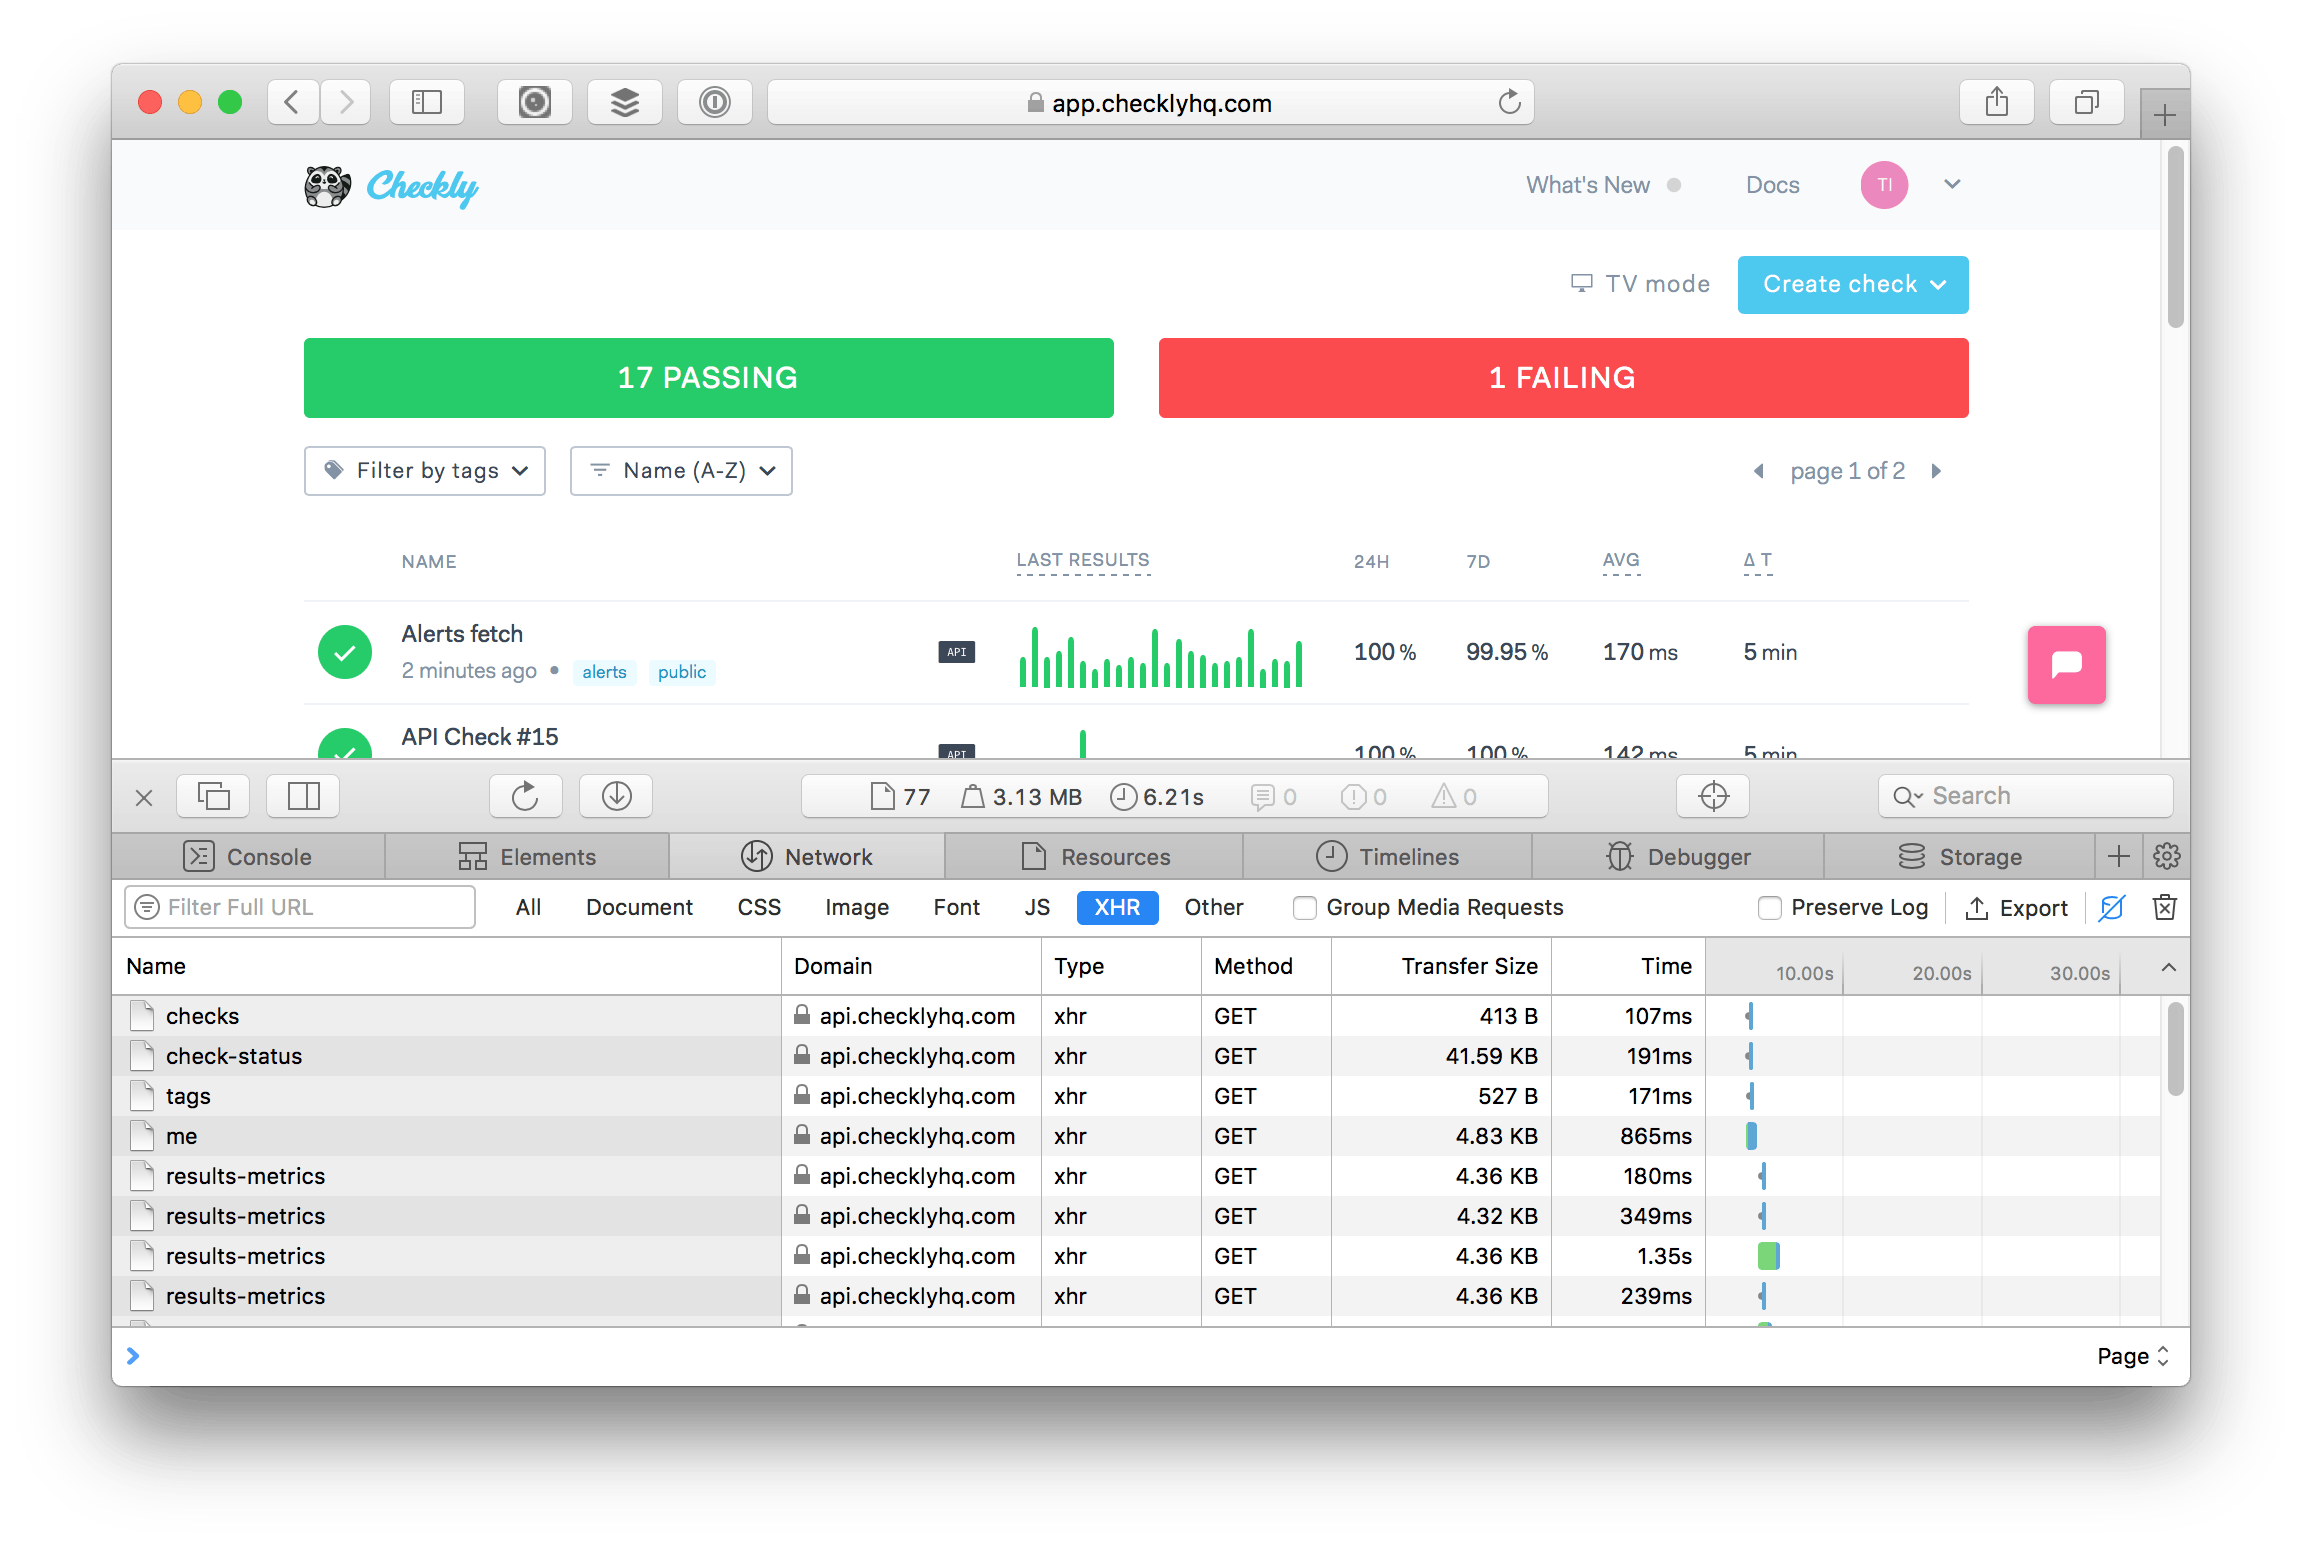
You can see these API requests flying by in your developer console. No secret stuff here.

In the screenshot above you can see that the /check-status call took 191ms. This is pretty good as it includes all aggregates and calculations for 18 checks in total. So roughly 10ms per check.
However, this was already in the 1.5 seconds to 2.5 seconds range before the optimizations discussed in this post. Customers have dashboards with 40+ checks so their performance was pretty miserable.
The metrics from Heroku (where we host the customer facing API) also showed this. Lots of spikes, and a p95 in the seconds.

The /results-metric calls are allowed to be much slower. They are essentially lazy loaded to fill out the green pointy bars in the little graph. If one takes a second, that's probably fine.
Long story short, the /check-status endpoint was getting too slow. It needed fixing. Onwards!
Analysis
Of course, I had hunch where I could improve performance. I've been growing Checkly for the past year and know the code base inside out.
- The
check_resultstable was growing. Not just due to more customers joining Checkly, but because we changed retention from 7 days to 30 days for raw check results fairly recently. After the 30 days, results are rolled up into a different table. - All aggregate calculations are done using a timestampz column.
- Almost all queries on this table filter either on
checkIdor oncreated_at - Almost all queries on this table are of the
ORDER BY <timestampz> DESCtype.
I first turned to Heroku's own toolset. With the help of this excellent post by schneems and Heroku's own docs on expensive queries I ran the heroku pg:outliers command which parses and presents the data from the pg_stat_statements table.
$ heroku pg:outliers
total_exec_time | prop_exec_time |  ncalls   |  sync_io_time   |                                                                                                                                                                     query
-----------------+----------------+-----------+-----------------+------------------------------------------------------------------------------------------------------------------------------------------------------------------------------------------------------------------------------------------------------------------------------------------------------------------------------------------------
 49:26:45.374033 | 32.4%          | 3,024,907 | 30:37:17.830208 | select "id", "responseTime", "hasFailures", "hasErrors" from "check_results" where "checkId" = $1 order by "created_at" desc limit $2
 34:14:25.316815 | 22.5%          | 248,647   | 02:04:20.841521 | select "checkId", ROUND($2 * (SUM(CASE WHEN "hasFailures" = $3 THEN $4 ELSE $5 END)::FLOAT / COUNT("hasFailures"))::NUMERIC, $6) AS "successRatio" from "check_results" left join "checks" on "checks"."id" = "check_results"."checkId" where "checks"."accountId" = $1 and check_results.created_at > now() - interval $7 group by "checkId"
There it was, the query eating up 32% of execution time. A really simple select query, no JOIN statements, nothing fancy.
SELECT "id", "responseTime", "hasFailures", "hasErrors"
FROM "check_results"
WHERE "checkId" = $1
ORDER BY "created_at" DESC LIMIT $2
Notice the second outlier query also has a statement filtering on created_at in addition to filtering on checkId
WHERE check_results.created_at > NOW() - INTERVAL $7 However, this is not a smoking gun. Maybe this percentage of execution time is fine. Maybe it's just a lot queries that execute really fast?
Luckily, Heroku Postgres has a "slowest execution time" tab in their graphical interface and it showed this exact query in the second position, just after a somewhat slower but much less crucial query.

The query was slow and frequently used. That's probably a smoking gun. 🔫
Two observations on the check_results table at this time:
- It has an index on
checkIdwhich is a foreign key to ourcheckstable. It's used to dig up individual check results and works fine. - I had an index on
created_at— a timestampz field — because I thought this would help. I was (sort of) wrong. As I dug into the code base, I saw that I used thestartedAttimestampz field also.
Actually, querying forstartedAtmade a lot more sense in our specific context ascreated_atwas influenced by how quickly our daemon process can gobble up our feed of check results. This was at most some milliseconds, but still. - All relevant queries were indeed filtering using
WHERE "checkId" = xorWHERE created_at > x - All relevant queries were indeed ordering using the
ORDER BY timestampz DESCstatement.
So, my early hunches were confirmed by the data and some code digging. My solution hypothesis was that I needed to do two things:
- Use just one timestampz field in all relevant queries:
startedAt - Add a composite index on
checkId, startedAt DESC
Note, that the order of the fields in the composite index is very important. This is because the first attribute in the index is crucial for searching and sorting.
Of course, you can only be sure if this fix works by reproducing the situation and measuring the outcome.
It's almost computer science.
Reproducing & fixing
You know what grinds my gears? Queries that are slow in production but fast on test and development. And this was exactly what I had on my hands here.
I located the piece of code responsible for this query fairly quickly. Hoorah for thin ORMs! Its response time was blazing on my dev box and on test. Clearly, the table size was just too small to have any impact. The EXPLAIN ANALYZE output of the query in question also showed a completely different execution plan.
So I whipped up a script to insert around a 500.000 records into my local check_results table and ran EXPLAIN ANALYZE again on our query.
-- before the new index
EXPLAIN ANALYZE(SELECT "id",
         "responseTime",
         "hasFailures",
         "hasErrors",
         "startedAt"
FROM "check_results"
WHERE "checkId" = '0d97011e-12b6-4bb2-ad17-9b22e5f3aeee'
ORDER BY created_at DESC limit 5000)

...
Sort Key: created_at DESC
Sort Method: top-N heapsort  Memory: 1948kB
	->  Index Scan using check_results_checkid_index on check_results
    Index Cond: (""checkId"" = '0d97011e-12b6-4bb2-ad17-9b22e5f3aeee'::uuid)
...

Planning time: 0.096 ms
Execution time: 25.353 ms
The execution time of 25ms seems fast, but keep in mind the table on my dev box is pretty small compared to the live version. Notice the Sort that happens before the index is actually used.
With the new index, it looks as follows:
-- after the new index
CREATE INDEX check_results_checkid_startedat_desc_index
ON check_results("checkId", "startedAt" DESC)

EXPLAIN ANALYZE(SELECT "id",
         "responseTime",
         "hasFailures",
         "hasErrors",
         "startedAt"
FROM "check_results"
WHERE "checkId" = '0d97011e-12b6-4bb2-ad17-9b22e5f3aeee'
ORDER BY  "startedAt" DESC limit 5000)

...
Index Scan using check_results_checkid_startedat_desc_index on check_results
Index Cond: (""checkId"" = '0d97011e-12b6-4bb2-ad17-9b22e5f3aeee'::uuid)
...

Planning time: 0.125 ms
Execution time: 2.744 ms
That's 2.7ms execution time. On my local box already a 10x reduction! The magic is of course in the composite index as there is no Sort step. The query never needs to scan either; the index is all it needs and indices are fast.
I wrapped the new index in a knex.js migration and pushed it to our test and later live environment. Let's look at some results.
Here are the Heroku metrics again. The p95 dropped from ~3 seconds to 175ms.

Also, the "Slowest execution time" tab now shows a query used in a batch job that takes ~30 seconds. Exactly as I expected and not annoying to users.
Lessons learned
In the end, the solution was fairly trivial. But most performance fixes are. The trick is in finding the right angle, the right test data and confirming your hypothesis. Also Postgres and Heroku are pretty awesome. Just saying. 😎
banner image: "Shiki Uta, Natsu no Gaku". (Songs of the Four Seasons; Summer), Kuniteru Utagawa, 1808-1876, Japan. Source


