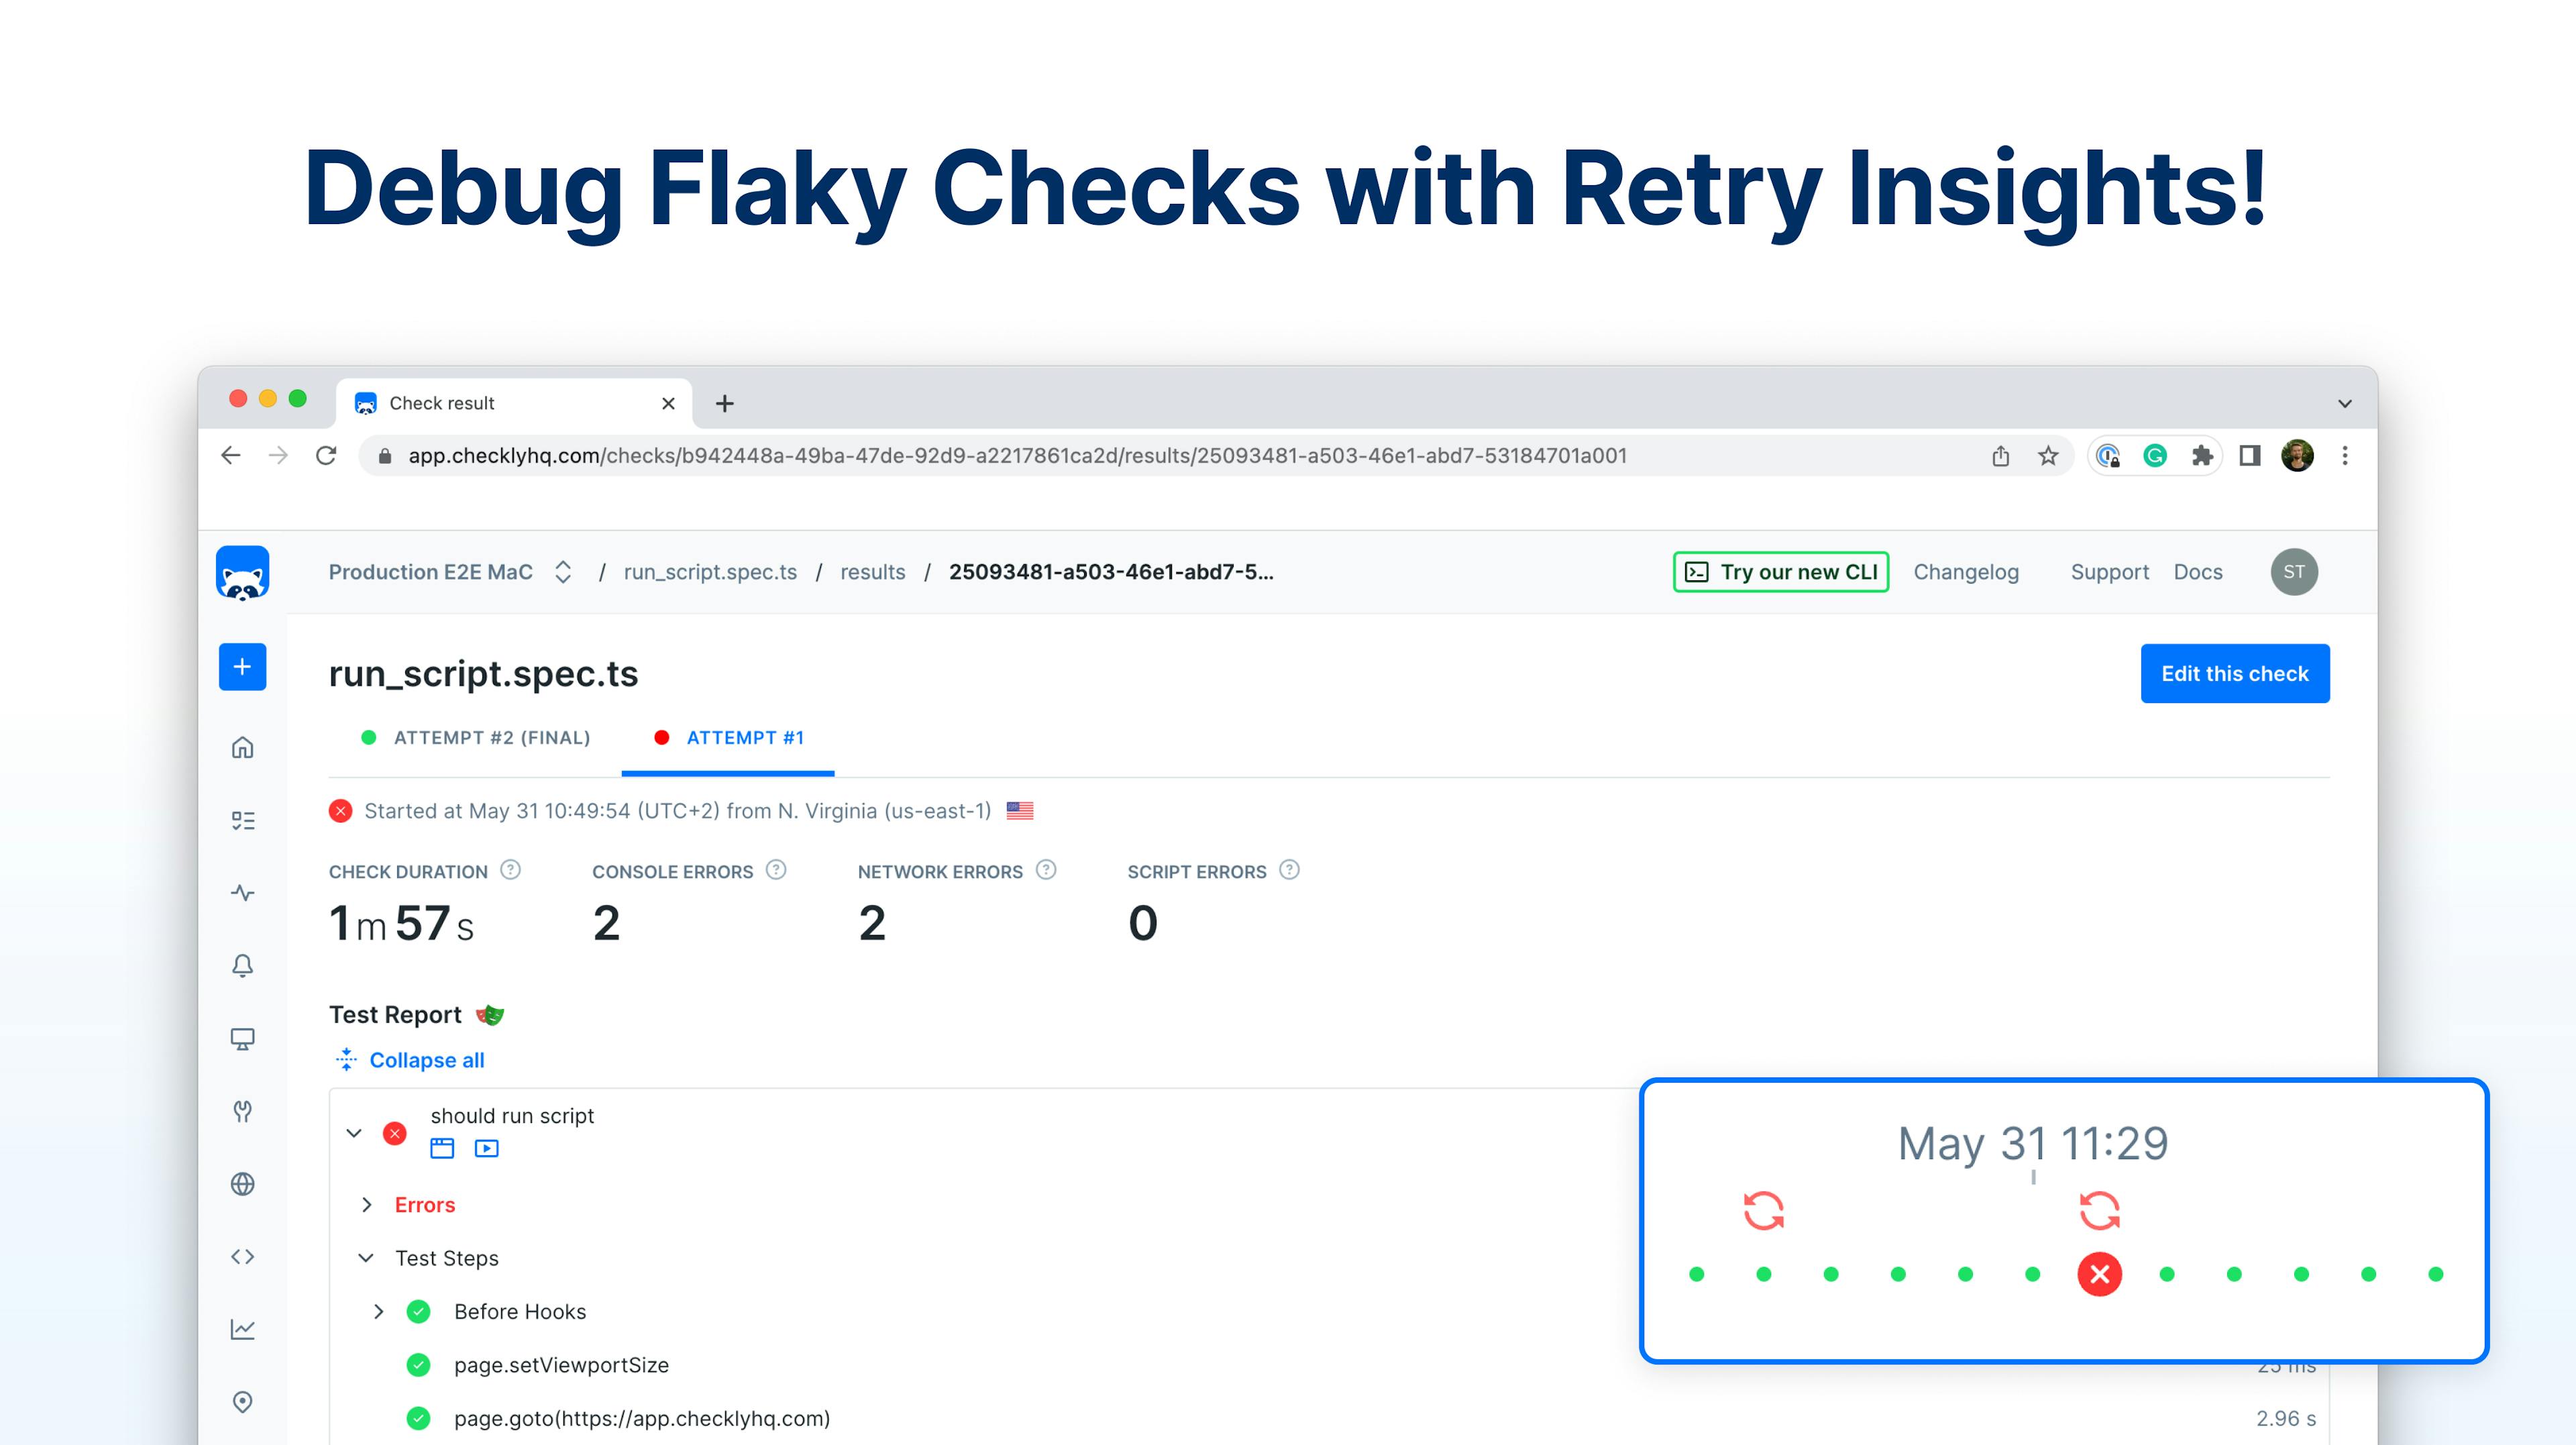
(Updated: )

Using Retry Insights to Identify Flaky Checks

Share on social

Debug flaky checks with retry insights!
Table of contents

As you know, having reliable checks is a cornerstone of synthetic monitoring. We don’t want false alarms, or worse, checks succeeding when things aren’t working. But sometimes, problems can be hard to identify because they only happen intermittently, or in certain situations.

Similarly, monitoring results can be skewed by infrastructure issues, or network errors on the monitoring provider end, causing false alarms when there is actually no problem with the product. 

Checkly provides automatic retries as a way to get around the false alarms problem, but until now it could have been hiding intermittent issues in products or checks.

Introducing Retry Insights

Check retries are a feature we’ve had in Checkly for a while. Retries happen when a check fails initially, and Checkly automatically reruns the check from a different location to make sure that the first failure wasn't due to an infrastructure problem, lost connectivity, or other issues. This is a default setting for all checks to prevent false alarms, but that can be toggled off.

Checkly UI showing the double-check feature

Previously, the initial attempt and the retry were both parts of the same check result, and only displayed errors or information from the retry. We were unable to provide information as to why the original attempt failed, and this made it difficult for users to know if a check run failed because of an issue with the check, or due to infrastructure issues.

With the introduction of retry insights, all attempts as well as the final result are stored, which allows us to provide the same level of information on the initial failed attempt as we do for the retry. This will enable you to identify and fix any issues that were previously invisible to you.

Checkly UI showing the check results with retry insights.

How Retry Insights will streamline your monitoring

The new retry feature exposes all errors encountered during check runs, even when there is a successful retry, allowing for more in-depth troubleshooting. Spending time following up on and addressing failed retries due to non-optimized checks helps with monitoring reliability and problem detection.

How to use the Retry Insights

  1. Retries are enabled by default for a new check. If you don’t want to make use of retries, you can toggle it off when editing the check. You can also toggle retries on entire check groups. Toggling off retries can be useful if you have a check that is supposed to fail.
  2. Keep an eye out for indicators that a check was retried & then successful - there are indicators both in the home dashboard & on the check overview page.
  3. You can now view both the final result & earlier attempts including all assets on your check result page - helping you understand what went wrong initially.

Retries visualized in Home Dashboard, Check Overview and Check results.

Common reasons for flaky checks

Retry Insights are especially useful to identify and debug flaky checks that initially fail but recover in the final attempt or seemingly randomly fail after all. Previously, the information of the initially failed check result would have been unavailable, but now you can access all attempts in a sequence of check runs. 

With the additional details, you might find any of the following issues:

  1. Network instability such as latency, dropped packets, or connectivity issues, can cause intermittent failures in the tests. If a network request fails or takes too long to complete, it can cause the test to fail after exceeding the timeout limit. The “Network” tab in your check result will help you identify potential problems.
  2. Poor test design leading to long scripts that don’t finish in time can cause timeouts and failed check runs. In this case, try to break up your check into multiple checks. For more information on timeouts have a look at our documentation.
  3. Location-based errors can lead to your check continuously failing in a specific region. This could be due to a location being unavailable, missing configurations, or parts of your infrastructure being blocked locally. To analyze the overall performance of your locations, head to the check overview page and view the “All Locations” table.
  4. Unreliable external dependencies are another factor to consider when investigating flaky checks. Third-party APIs, databases, or other microservices can affect your check result for reasons such as slow response times or rate limiting. Isolating the failing part of your check and inspecting the “Network” tab of your result can be a good place to start debugging.

Battling check flakiness is one of the main challenges in synthetic monitoring but with retry insights, you now have a tool to identify and debug the flakiness root cause!

Start digging deeper and if you have feedback, jump into our Community Slack and let us know about it!

Share on social