table of contents Table of contents

Laravel

This guide will help you instrument your Laravel application(s) with OpenTelemetry and send traces to Checkly.

Step 1: Install the OpenTelemetry extension

pecl install opentelemetry

Check if the opentelemetry extension is properly installed and enabled:

php --ri opentelemetry

You should see something similar to:

opentelemetry

opentelemetry hooks => enabled
extension version => 1.0.3

Directive => Local Value => Master Value
opentelemetry.conflicts => no value => no value
opentelemetry.validate_hook_functions => On => On
opentelemetry.allow_stack_extension => Off => Off

If you are not getting a similar output, check your php.ini file and make sure a line is added similar to this:

extension=/some/path/opentelemetry.so

Now install the automatic Laravel instrumentation.

composer require open-telemetry/opentelemetry-auto-laravel

Step 2: Install the OpenTelemetry SDK

composer require \
  open-telemetry/opentelemetry \
  open-telemetry/sdk \
  open-telemetry/api \
  open-telemetry/opentelemetry-auto-slim \
  open-telemetry/opentelemetry-auto-laravel \
  open-telemetry/exporter-otlp

Now install the automatic Laravel instrumentation.

composer require open-telemetry/opentelemetry-auto-laravel

Step 3: Initialize the instrumentation

This example shows all the code you will need to add to your index.php.

Notice the ChecklySampler class. This is a custom, head-based sampler that will only sample spans that are generated by Checkly by inspecting the trace state. This way you only pay for the egress traffic generated by Checkly and not for any other traffic.

<?php

use Illuminate\Http\Request;

// ===== OpenTelemetry imports =====

use OpenTelemetry\API\Trace\Propagation\TraceContextPropagator;
use OpenTelemetry\Context\ContextInterface;
use OpenTelemetry\Contrib\Otlp\SpanExporterFactory;
use OpenTelemetry\SDK\Sdk;
use OpenTelemetry\SDK\Trace\SpanProcessor\BatchSpanProcessor;
use OpenTelemetry\SDK\Trace\TracerProvider;
use OpenTelemetry\SDK\Common\Time\ClockFactory;
use OpenTelemetry\SDK\Trace\SamplerInterface;
use OpenTelemetry\SDK\Trace\SamplingResult;
use OpenTelemetry\SDK\Trace\Span;
use OpenTelemetry\SDK\Common\Attribute\AttributesInterface;

define('LARAVEL_START', microtime(true));

if (file_exists($maintenance = __DIR__.'/../storage/framework/maintenance.php')) {
    require $maintenance;
}

// Register the Composer autoloader...
require __DIR__.'/../vendor/autoload.php';

// ===== OpenTelemetry custom cofiguration =====

class ChecklySampler implements SamplerInterface {
    public function shouldSample(
        ContextInterface $parentContext,
        string $traceId,
        string $spanName,
        int $spanKind,
        AttributesInterface $attributes,
        array $links
    ): SamplingResult {
        $parentSpan = Span::fromContext($parentContext);
        $parentSpanContext = $parentSpan->getContext();
        $traceState = $parentSpanContext->getTraceState();

        if ($traceState !== '' && $traceState !== null && str_contains($traceState, 'checkly')) {
            return new SamplingResult(
                SamplingResult::RECORD_AND_SAMPLE,
                [],
                $traceState
            );   
        } else {
            return new SamplingResult(
                SamplingResult::DROP,
                [],
                $traceState
            );
        }
    }

    public function getDescription(): string
    {
        return 'ChecklySampler';
    }
}

$exporter = (new SpanExporterFactory())->create();

$tracerProvider = new TracerProvider(
    new BatchSpanProcessor($exporter, ClockFactory::getDefault()),
    new ChecklySampler()
);

Sdk::builder()
    ->setTracerProvider($tracerProvider)
    ->setPropagator(TraceContextPropagator::getInstance())
    ->setAutoShutdown(true)
    ->buildAndRegisterGlobal();


// Bootstrap Laravel and handle the request...
(require_once __DIR__.'/../bootstrap/app.php')
    ->handleRequest(Request::capture());

Step 3: Start your app with the instrumentation

Toggle on Import Traces and grab your OTel API key in the OTel API keys section of the Traces page in the Checkly app and take a note of the endpoint for the region you want to use.

Checkly OTEL API keys

Now, export your API key in your shell by setting the 
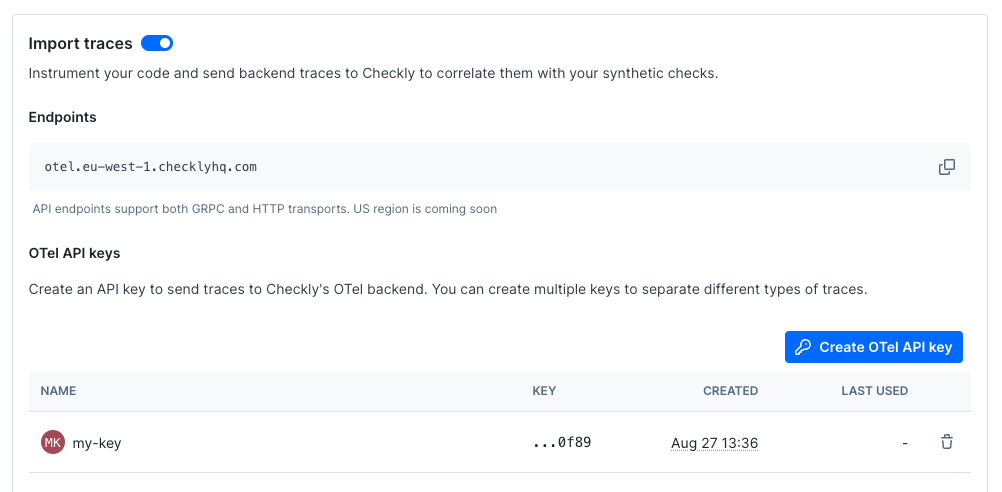
OTEL_EXPORTER_OTLP_HEADERS environment variable.

export OTEL_EXPORTER_OTLP_HEADERS="authorization=<your-api-key>"

Next, export the endpoint for the region you want to use and give your service a name.

export OTEL_EXPORTER_OTLP_ENDPOINT="https://otel.eu-west-1.checklyhq.com"
export OTEL_SERVICE_NAME="your-service-name"

Then, explicitly set the protocol to use for the OTLP exporter.

export OTEL_EXPORTER_OTLP_PROTOCOL="http/protobuf"

We are using the standard OpenTelemetry environment variables here to configure the OTLP exporter.

Variable Description
OTEL_EXPORTER_OTLP_HEADERS The Authorization HTTP header containing your Checkly OTel API key.
OTEL_EXPORTER_OTLP_ENDPOINT The Checkly OTel API endpoint for the region you want to use.
OTEL_EXPORTER_OTLP_PROTOCOL The protocol to use for the OTLP exporter.
OTEL_SERVICE_NAME The name of your service to identify it among the spans in the web UI.

Finally, start your app:

php artisan serve

🎉 You are done. Any interactions with your app that are triggered by a Checkly synthetic monitoring check will now generate traces, which are sent back to Checkly and displayed in the Checkly UI.


Last updated on August 27, 2024. You can contribute to this documentation by editing this page on Github